
vamshigvk
Vamshi Krishna Gundu
Recently Published
Presentation Slide For Word Prediction
Data science capstone project
Data science capstone week 2 milestone report
The goal of this report is to show the summary of the data, exploratory data analysis of the en_UD text files we have got them from week1, and to create a prediction algorithm. The 3 documents of text files we have downloaded are 1. en_US.twitter.txt 2. en_US.news.txt 3. en_US.blogs.txt

Practical Machine Learning Week4
Practical Machine Learning Week4 assignment

Presentation-DDPW4
developing data products assignment week4 of R-coursera
presetation of shiny application http://vamshigvk.shinyapps.io/DDPW4
Titanic Analysis
Analysis was done on Titanic data and predicted the survival of passengers using several models. Uploaded the resulted data on Kaggle and the accuracy of the predictions were like:
Logistic Regression - 77.99%
Decision Tree - 79.42%
Random Forest Trees - 76.55%
Sentiment Analysis
Sentiment Analysis on Jane Austen books using janeausternR package
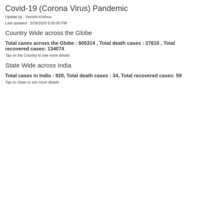
corona
Infected, Recovered and Death stats by Corona virus across the Countries and Indian states
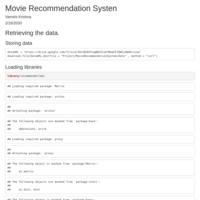
Movie Recommendation using recommendarLab
Recommends 10 movies for users who have rated more than cutting point ratings and similarly with movies which has enough number of ratings.
Plots with Plotly
Boxplot and Heatmap plots using Plotly package for week3 assignment of developing data products

Developing data products week 2 assignment
Developing data products week 2 assignment , our house in my home town.

Vamshi's Home
Map from leaflet consists a marker on Vamshi's home with his linkedIn Profile as popup.
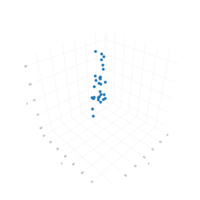
3d plot for trees dataset
3d plot for trees dataset using plot_ly , type="scatter3d"
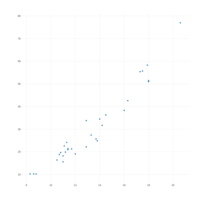
Trees plot with plot_ly
simple scatterplot of trees dataset using plot.ly package
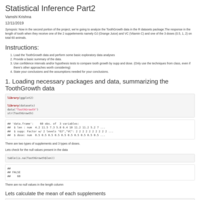
Tooth growth data
We analyze the Growth of the tooth in length of 30 subjects when given two different supplements with 3 levels of dosages.
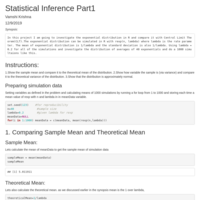
Simulation of Exponential Distribution
Compare theoretical and sample mean, variance, Confidence interval and prove this distribution is an approximately Normal distribution
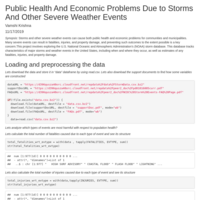
Public Health And Economic Problems Due to Storms And Other Severe Weather Events
Analysis of which types of events are most harmful with respect to population health and greatest economic consequences?
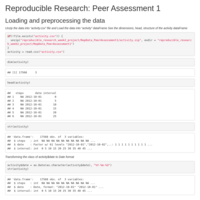
Reproducible research week 2 Project
Analysis of steps with 5 minute interval from personal activity monitoring device