
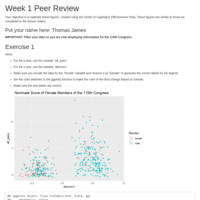
tjamesbu
Thomas J James
Recently Published
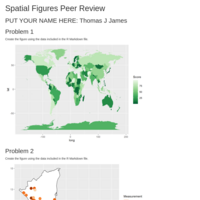
Spatial_Figures_Peer_Review
Spatial_Figures_Peer_Review
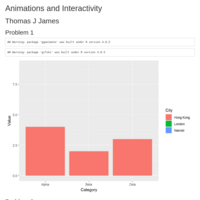
Advanced_Data_Visualization_with_R_Week_1
Week 1 Assignment in Johns Hopkins University Coursera course Advanced Data Visualization with R
Text_Prediction_Application
Text Prediction Application Created using RStudio
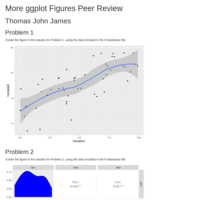
Practice_with_Univariate_Figures_and_Scatter_Plots
Practice_with_Univariate_Figures_and_Scatter_Plots
Data_Science_Capstone_Week_2A
Data_Science_Capstone_Week_2A
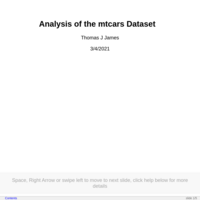
analysis_of_mtcars_database_presentation-rpubs
Developing_Data_Products_Course_Assignment

Developing_Data_Products_Week_3_Assignment
Using the `mtcars` dataset we plot can attempt to understand the relationship
of various factors to gas mileage (`mpg`).
We plot weight (`wt`) vs. mileage (`mpg`) spatially along the x/y axes. We
visualize the number of cylinders (`cyl`) as colors and the amount of
horsepower (`hp`) as the size of an individual point in the plot.
Developing_Data_Products_Week_2_Assignment
Developing_Data_Products_Week_2_Assignment
Reproducible Research Peer Assessment 2
Impact of Severe Weather Events on Public Health and Economy in the United States