
susannah
Susanna H
Recently Published

Plot
Preexisting neutropenia OR for dmt

Forest plot
Logistic regression 3-4 vs 0-2

Plot
Forest logit 3-4


Forest plot
Binary outcome 2-4 logistic regression with significance

Forest plot
For binary outcome

Plot
Lollipopp

Plot
Lollipop 3 neutropenia proportions

Plot
Lollipop 3 decimals

Plot
LON proportions

Plot
Lollipop with proportions

Plot
Neutrophil trend by DMT

Plot
Neutrophil trend by DMT

Plot
ANC trajectories <5

Plot
ANC trajectories after LON <7.5

Plot
ANC trajectories <10

Plot
ANC trajectories

Plot
Neutrophils after LON <3

Plot
Neutrophils after LON <7

Plot
Since LON event <10

Plot
Neutrophils since the LON event <5

Plot
Neutrophils since the LON event

Plot
Since LON event full set

Plot
LON from LON event <5

Plot
LON trends since RTX start

Plot
Neutrophil trends in RTX therapy for pwMS experiencing LON


Plot
Neutrophil trends during RTX therapy in pwMS with preexisting neutropenia",
"Faceted by prior DMT use and sex",


Plot
Timeline for neutrophil trends for individuals with a low measurement pre-RTX and a fluctuating pattern

Fluctuating pattern pre-RTX
Timeline for fluctuating patterns in ANC for individuals starting with neutropenia pre-RTX


v
Timeline for ANC faceted by number of LON events three horizontal 250815

Plot
Neutropenic events facet

Plot
Neutropenia grade 2-4

Plot
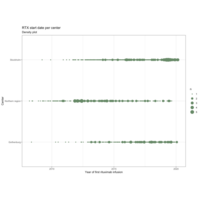
Grade 3-4 events by center and individual

Plot
Neutropenic events by center

Plot
Neutropenic events timeline

Neutropenia events timeline
Timeline of neutropenia events per individual and center


Neutropenia event by grade
250314

HTML
Mean and median time in days between neutropenic events before and after rtx

HTML
Summary statistics for time from neutropenia before rtx to next event

HTML
Summary table for individuals with neutropenia before the first dose of rituximab or within the first 30 days

HTML
Summary of low neutrophil counts before RTX start or during the first 30 days

HTML
Individuals with low initial neutrophil count 250314

Plot
Neutropenia proportions 250314

HTML
Table number of LON events stratified by time from rtx start, but the values must be checked 250311

Plot
LON event 250311

Plot
Time from rtx start to LON event (most severe measurement) stratified by neutropenia grade 250311

HTML
Neutropenia grades and proportions 250311

HTML
Neutropenia grades and proportions 250311

Plot
Neutropenia_grades_250311

Plot
Neutropenia grades 250311

Plot
Neutropenia grades 250311

Plot
Neutropenia grades

HTML
Baseline table by Neutropenia status

HTML
Baseline table filtered - MS type

HTML
Baseline filtered - center

Plot
proportion LON

HTML
Baseline MS-type

HTML
Baseline center

HTML
Baseline table by center

HTML
Baseline table by MS-type

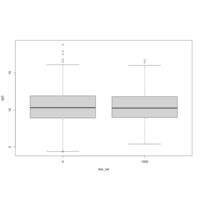
Boxplot neutrophils per center
Enkel neutrofilplot per center, utan de med HSCT-beh

HTML
Baseline data for LON and by MS type


HTML
LON baseline data
PreviousTRT01
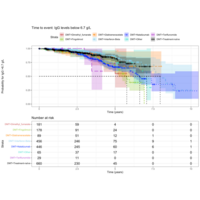
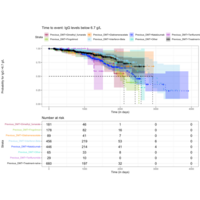
RTX survival plot for previous treatments, with time to LLN 6.7 g/L in years
Plot
Survival LLN and previous treatment
Plot
testplot