
statooed
Tasneem Zaihra Rizvi
Recently Published

WordCloud
This is a minimal Code to Create Word Cloud for qualitative studies recording transcripts


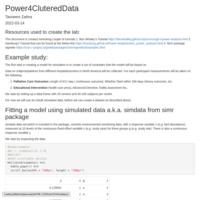
OverlapWeightTutorial
This is a short tutorial on how to fit overlap weight models.


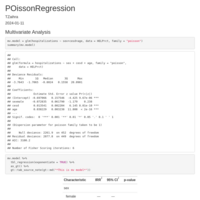
Poisson Model Univariate vs Multivariate
Double checking if tbl_regression univariate IRR matches one univariate model at a time
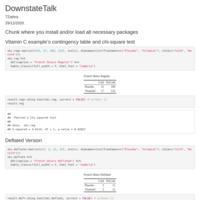
DownstateTalk
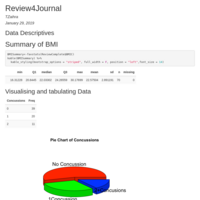
Chi-square test's sensitivity analysis using a made up data

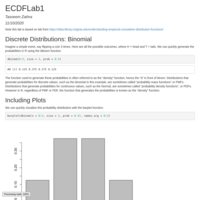

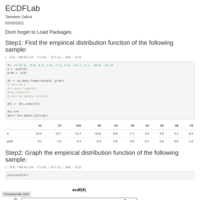
Empirical Cumulative Distribution Function ( ECDF lab)
This lab describes the concept of cdf and ecdf.
It is based on
Note this lab is based on lab from https://data.library.virginia.edu/understanding-empirical-cumulative-distribution-functions/
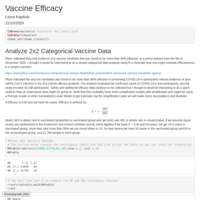
Laura's Lab on Pfizer vaccine
By Laura Kapitula
Basic idea:
## Analyze 2x2 Categorical Vaccine Data
Pfizer indicated they had evidence of a vaccine canditate that was found to be more than 90\% effective. In a press-release from the 9th of November 2020. I thought it would be interesting to do a simple categorical data analysis using R to illustrate how one might estimate effectiveness in a simple scenario.
<https://www.pfizer.com/news/press-release/press-release-detail/pfizer-and-biontech-announce-vaccine-candidate-against>
Pfizer indicated the vaccine candidate was found to be more than 90\% effective in preventing COVID-19 in participants
without evidence of prior SARS-CoV-2 infection in the first interim efficacy analysis. The analysis evaluated 94 confirmed cases of COVID-19 in trial participants, and the study enrolled 43,538 participants. Safety and additional efficacy data continue to be collected but I thought it would be interesting to do a quick study to help us understand what might be going on. Note that they probably have more complicated models with stratification and might be using a Poisson model or other Generalized Linaer Model to get estimates but for simplification sake we will make some assumptions and illustrate.
If Efficacy is 0.90 and we have 94 cases,
Efficacy is defined as:
$$E = 1 -\frac{ARV}{ARU}$$
where $ARV$ is attack rate in vaccinated (proportion in vaccinated group who get sick)
and $ARU$ is attack rate in unvaccinated, if we assume equal counts are randomized to the treatement and control condition and do some algebra if we have $E=0.90$ and 94 cases, we get 10.4 cases in vaccinated group, since they said more than 90% we can round down to 10.
So that means we have 10 cases in the vaccinated group and 84 in the unvaccinated group, and 21,769 people in each group.
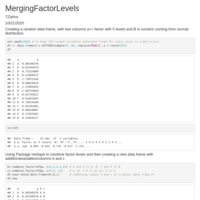
Merge_Create_Reorder_Categories
This lab shows how you can create categories, merge categories and re order categories by median (say) to produce ordered box-plots.
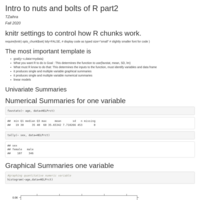
Nuts and Bolts of R and RStudio Part2
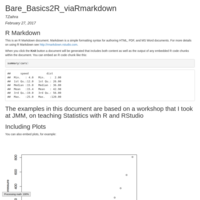
In this lab we discuss basic descriptive tools used in Statistics for exploring data graphically using R and RStudio via a markdwon file and package mosaic
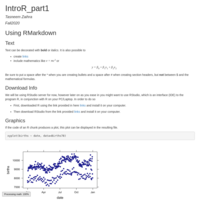
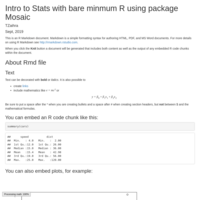
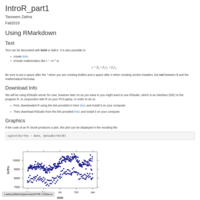
Introduction to R n RStudio by Dr. Zaihra part1
This is part 1 of a series of labs created by Dr. Z to help you get started with R and R Studio
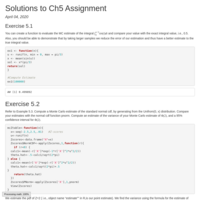
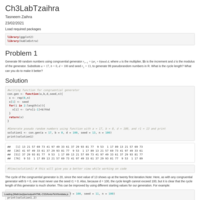
Chapter5 Computing Assignment
Monte Carlo Estimates of Integrals
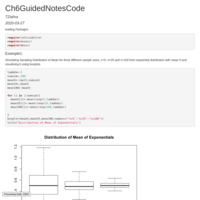
Ch5 Computing Lab: Nuts and bolts of Simulation
This lab guides you through the various codes used in the process of MC simulation.
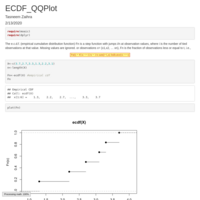
ECDF_Quantiles
This lab demonstrates usage of R functions to estimate ecdf, plot ecdf, and compare theoretical and empirical distributions using qqplot and qqnorm. It also illustrates how quantiles are computing by the generic function quantile in R. Furthermore, it has two solved examples.
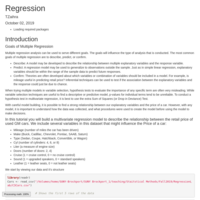
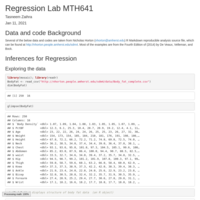
Regression Lab
Using Cars Data we look at various aspects of multiple regression: The question is how much is your car worth?


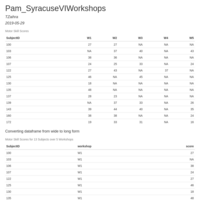
Pam_VIWorkshop_MotorSkills
This is an initial exploratory analysis of the motor skills data
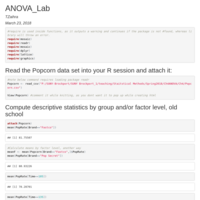
ANOVA LAB
This Lab describes how to use R for 2 way ANOVA using Popcorn Data
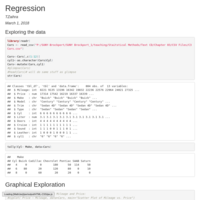
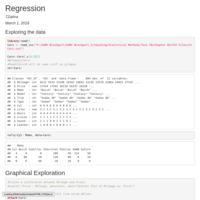
Regression Lab: Spring 2018
We use data collected from Kelly Blue Book for several hundred 2005 used General Motors (GM) cars to explore and develop a multivariate regression model to determine car values based on a variety of characteristics such as mileage, make, model, engine size, interior style, and cruise control. In this lab we learn to look at residual plots to check for model assumptions, namely, heteroskedasticity, normality, and multicollinearity as well as explore techniques for variable selection and transformation of variables ot meet model assumptions.
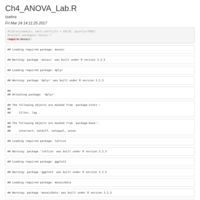
Ch4_Lab_ANOVA
Helpful R Code for ANOVA
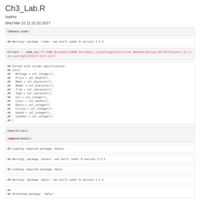
Chapter 3_Rcodes_Statistical Methods
Regression Lab


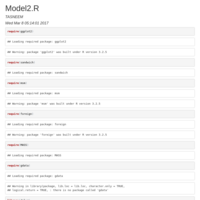
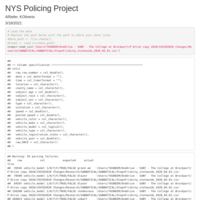
Model1+ it's corresponding robustness tests
Model 1
*Dependent Variable
* The lag of terrorist incidents involving Americans
* Independent Variables
The log of the population of the terrorists’ home country
The log of GDP/capita of the terrorists’ home country
The log of U.S. Military Aid to the terrorists’ home country
The log of the area of the terrorists’ home country
The Polity Democracy score of the terrorists’ home country
The CINC national capacity index of the terrorists; home country
Women’s economic rights of the terrorists’ home country
Robustness tests
R1: Model 1, plus a dummy for Muslim majority countries
R2: Model 1, plus the measure for physical integrity
R3: Model 1, plus the measure of American alliances
R4: Model 1, plus the count of terrorist incidents in the preceding year

Presentation
RWorkshop 2017
R workshop Feb 27, 2017
Simple examples using package MOSAIC
PS: The examples are taken from R Workshop conducted at JMM by RJP
Chapter 2_codes_Statistical Methods
Making connections between t-test, Regression and ANOVA using an online game data
knitr_demo
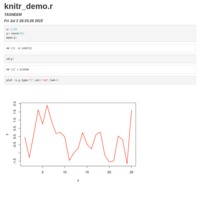
This is a basic demonstration of using package knitr with RStudio.Follow the steps enumerated below:
1) Compile your R code.
2) Save it in the working directory
3) Click on the notebook sign in the console of RStudio and run