sedzinfo
Dimitrios Zacharatos
Recently Published

GREEK HOUSING
The OECD publishes yearly analytical house price indicators for its members and partner countries: an index of rent prices, an index of house prices, and two affordability ratios — price-to-income and price-to-rent. The OECD gives them as indices with 2015 = 100; here every value is turned into a plain percentage change since 2015 — “+13%” means rents are 13% higher than in 2015. They show how much each market moved, not the level of rents in euros.
This vignette pulls the series straight from the OECD data API and builds the same kind of visualisations as the EU Salary Race: a ranked “bar chart race” and a shareable GIF — with Greece highlighted in red against the rest of Europe in gray. It starts with a look at Greece on its own, since rents and house prices there have taken very different paths.

GLM COMPUTE AOV ES
This shows the output of compute_aov_es from the package rwf, which takes a between-subjects aov model, builds its ANOVA table with Type I, II or III sums of squares and adds six effect sizes for every factor and interaction: eta-squared, partial eta-squared, omega-squared, partial omega-squared, epsilon-squared and Cohen’s f. Each section gives the formulas the function uses, computes them by hand and checks the results against effectsize, sjstats, car and compute_one_way_test.

GLM COMPUTE POSTHOC
This shows the output of compute_posthoc from the package rwf, which compares every pair of group means after a one-way ANOVA with two post hoc tests: the Tukey-Kramer test (Tukey, 1953; Kramer, 1956), which assumes equal variances, and the Games-Howell test (Games & Howell, 1976), which does not. For each pair of groups the function returns the t statistic, the degrees of freedom and a p value adjusted for all the pairwise comparisons. Each section gives the formulas the function uses, computes them by hand and checks the results against stats, emmeans and rstatix.

GLM ONE WAY
This shows the output of compute_one_way_test from the package rwf, which runs the one-way analysis of variance for two or more independent groups, either assuming equal variances (Fisher’s F test) or not (Welch’s F test, Welch, 1951). The function returns the sums of squares and mean squares, the F statistic with its degrees of freedom and p value, five effect sizes (eta-squared, partial eta-squared, omega-squared, partial omega-squared and Cohen’s f) and the observed power. Each section gives the formulas the function uses, computes them by hand and checks the results against stats, car, lsr, effectsize, sjstats and pwr.

GLM FRIEDMAN
This shows the output of compute_friedman_test from the package rwf, which runs the Friedman rank-sum test (Friedman, 1937), the non-parametric alternative to the one-way repeated measures ANOVA. The function returns the test statistic Q
with its degrees of freedom and p value, Kendall’s coefficient of concordance W
(Kendall & Babington Smith, 1939) as the effect size and, optionally, a bootstrap confidence interval for W
. Each section gives the formulas the function uses, computes them by hand and checks the results against stats, coin, rstatix and effectsize.

GLM KRUSKAL WALLIS
This shows the output of compute_kruskal_wallis_test from the package rwf, which runs the Kruskal-Wallis rank-sum test (Kruskal & Wallis, 1952), the non-parametric alternative to the one-way ANOVA. The function returns the test statistic H
with its degrees of freedom and p value, two effect sizes (rank eta-squared η2H
and rank epsilon-squared ε2R
) and, optionally, bootstrap confidence intervals for both effect sizes. Each section gives the formulas the function uses, computes them by hand and checks the results against stats, coin, rcompanion, rstatix and effectsize.

Plot Means, Interactions and ANOVA Diagnostics
This shows the output of plotting functions from the package rwf for visualising group means, interactions, and ANOVA model diagnostics. The plots accompany ANOVA results: they show what the model found (means plots, interaction plots) and whether its assumptions hold (diagnostic plots).

GLM IRT Unidimensional
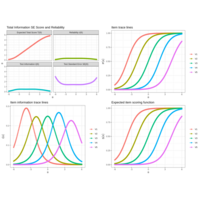
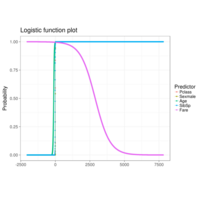
This shows the output of a from-scratch, base-R implementation of unidimensional IRT from the package rwf. The functions compute the item response function with optional guessing and inattentiveness parameters (compute_unidimensional_theta), item and test information for the 1PL, 2PL and 3PL models (compute_info_1pl, compute_info_2pl, compute_info_3pl), standard errors (compute_se_theta), and Maximum Likelihood ability estimates with a Newton-Raphson routine (compute_unidimensional_ability).

GLM Linear Regression
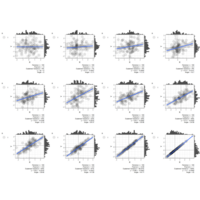
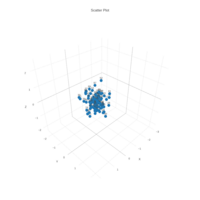
This shows the output of linear regression functions from the package rwf. The functions cover scatterplot visualisation and full regression reporting for both simple and multiple regression models.

NLP
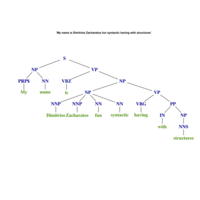
This shows the output of functions from the package rwf that may be used in Natural Language Processing (NLP). The functions clean text, remove stopwords, tag parts of speech, compute text similarity between documents, and calculate word and character statistics.

GLM RELIABILITY
This shows the output of reliability and validity functions from the package rwf. The functions include Cronbach’s alpha and its item-level diagnostics, a Multitrait-Multimethod (MTMM) matrix for convergent and discriminant validity, and variance-components-based reliability (Shrout-Fleiss) for person × item × time measurement designs.

GLM SEM
This shows the output of Structural Equation Modeling (SEM) and Confirmatory Factor Analysis (CFA) functions from the package rwf. The functions include a path diagram plotter that does not need semPlot, a full CFA report (fit indices, parameter estimates, modification indices, predicted scores), and a sample-size planning simulation that tracks how model fit changes as sample size grows.

GLM MEANS
This shows the output of mean comparison functions from the package rwf: report_ttests and report_wtests. Both functions run pairwise comparisons between the levels of each independent variable and return a table with test statistics, effect sizes, confidence intervals, and Bonferroni-adjusted significance flags.

GLM IRT T
This shows the output of Thurstonian IRT functions from the package rwf, for forced-choice and ranking questionnaires where respondents rank or compare items within blocks instead of rating each item independently. The functions cover the full workflow: building the comparison design, encoding rank data into the binary pairwise-comparison format the model needs, a from-scratch single-dimension item characteristic curve and grid-based ability estimator, a MAP/Empirical-Bayes-Modal scorer that reproduces thurstonianIRT::predict() directly from a fitted lavaan model’s parameters, and a Heywood-case diagnostic for the lavaan fit.

GLM IRT
This shows the output of unidimensional IRT reporting functions from the package rwf. The functions are plot_irt_onefactor (test information and expected score curves) and report_irt (a full model report: coefficients, local independence diagnostics, absolute and relative fit statistics). Both use models fit with the mirt package.

GLM HLR
This shows the output of the Hierarchical Linear Regression (HLR) function report_hlr from the package rwf. HLR builds regression models in sequential steps (blocks), adding predictors at each step. This shows how much additional variance each new set of predictors explains beyond the earlier ones, measured as the change in R² (ΔR²).

GLM EFA
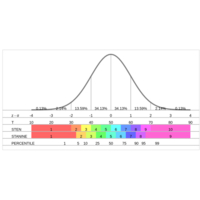
This shows the output of Exploratory Factor Analysis (EFA) functions from the package rwf. EFA uncovers the latent structure underlying a set of observed variables: it identifies groups of variables that share common variance, which are interpreted as factors. The functions include loading plots, scree plots, loading tables, residual diagnostics, and a full EFA report.

GLM CORRELATION
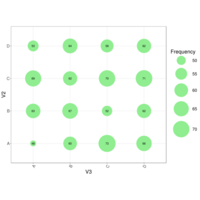
This shows the output of correlation functions from the package rwf. The functions include a correlation heatmap plotter, power analysis for correlation tests, a full bivariate correlation report (r, p, CI, adjusted p and sample size, all as lower-triangle matrices), and special correlation types for dichotomous and ordinal data (tetrachoric, polychoric, biserial, polyserial).

GLM ANOVA
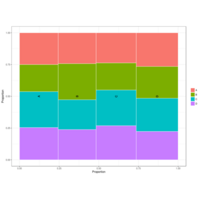
This shows the output of ANOVA-related functions from the package rwf. The functions cover non-parametric alternatives (Kruskal-Wallis), one-way and factorial ANOVA, MANOVA, effect size estimation, and post hoc comparisons. Each section shows rwf output alongside equivalent results from established packages so you can verify the numbers.

FUNCTIONS TRAIN TEST
This shows the output of useful functions for training and testing from the package rwf. The functions include plotting ROC curves, confusion matrices, separability plots, and evaluating confusion matrix performance at different cut-off points. Additionally, it demonstrates k-fold and k-sample cross-validation procedures, scaling data, and calculating confusion matrix statistics.

EAP Dihcotomous IRT Ability Estimation in base R
The functions in cat_eap_common.R and cat_eap_dichotomous.R are adapted from the source code of the catR package by David Magis, Gilles Raîche and Juan Ramón Barrada (Magis & Raîche, 2012; Magis & Barrada, 2017).


NASA GISS Global Temperature Anomaly
This document is a modification of original work by hrbrmstr (Bob Rudis). The visualizations have been updated to use the most recent NASA GISS surface temperature data and adapted with additional chart types.


R Colors: Names, RGB/HSV, and Building a Color Chart
Stowers Institute for Medical Research (original script)

Global Surface Temperatures animated spider plot
Temperature deviation (°C) from the 1951–1980 baseline, combining land surface and ocean measurements (1880–2026). Negative values indicate cooler periods; positive values indicate warming. Recent years (2023–2024) exceed +1.2°C, approaching the Paris Agreement 1.5°C threshold. Source: NASA GISS Surface Temperature Analysis (GISTEMP v4).


Global Surface Temperatures Heatmap
Temperature deviation (°C) from the 1951–1980 baseline, combining land surface and ocean measurements (1880–2026). Negative values indicate cooler periods; positive values indicate warming. Recent years (2023–2024) exceed +1.2°C, approaching the Paris Agreement 1.5°C threshold. Source: NASA GISS Surface Temperature Analysis (GISTEMP v4).

HTML
Average full-time adjusted salaries per employee in Greece -in red-\ncompared with EU countries (source: Eurostat)