
miyoung
Miyoung Yoon
Recently Published

Location Intelligence with R and Mapbox - Milwaukee County Park
I participated in Kyle Walker's workshop 'Location Intelligence with R and Mapbox' on May 15, 2024. This R Markdown document is my exercise using the Mapbox API. Below are the basic packages I installed. I have removed my personal Mapbox token from this document.

Location Intelligence with R and Mapbox - Milwaukee County Park
Milwaukee County Park

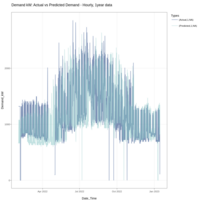
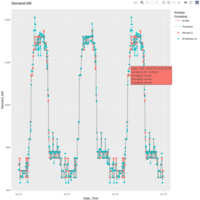
Demand kW: Actual vs Predicted Demand - Hourly, 1year data
demand_1year_hourly<-ggplot(data=demand_1year_hourly_v2, aes(x=Date_Time, y=Demand_kW, color=Types))+
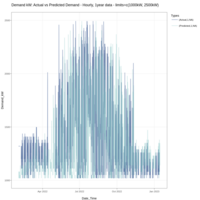
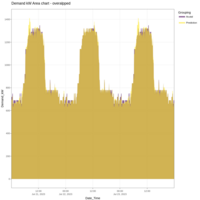
Demand kW: Actual vs Predicted Demand - Hourly, 1year data - limits=c(1000kW, 2500kW)
Demand kW: Actual vs Predicted Demand - Hourly, 1year data - limits=c(1000kW, 2500kW)
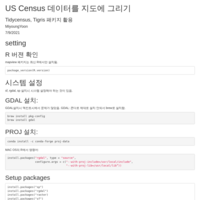
US Census 데이터를 지도에 그리기
Tidycensus, Tigris 패키지 활용
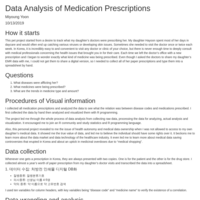
Data Analysis of Medication Prescriptions
How it starts:
This pet project started from a desire to track what my daughter’s doctors were prescribing her. My daughter Hayoon spent most of her days in daycare and would often end up catching various viruses or developing skin issues. Sometimes she needed to visit the doctor once or twice each week. In Korea, it is incredibly easy to and convenient to visit any doctor or clinic of your choice, but there is never enough time to deeply consult with medical professionals concerning the health issues that brought you in for their care. Each time we left the doctor’s office with a new prescription and I began to wonder exactly what kind of medicine was being prescribed. Even though I asked the doctors to share my daughter’s EMR data with me, I could not get them to share a digital version, so I needed to collect all of her paper prescriptions and type them into a spreadsheet by hand.
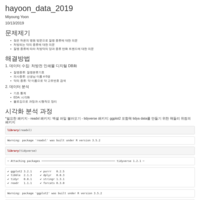
Hayoon's data 2019
하윤의 2019년 소아과 처방전 데이터 EDA