
janisharris
Janis Harris
Recently Published

Part 2 of the Mobile Massage Business Analysis after Forecasting with Prophet in R
Run through this document to see one way to do exploratory data analysis, extract information that could be very useful to marketing strategies to find target audience and marketing promotions. Use Prophet for timeseries forecasting to see the predictive analytics for the next year sales or income for in home mobile massage services. Previous document detailed the beginning and this is an extension of that document attached at the end with the line of equal signs.
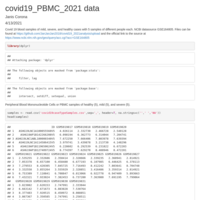
Covid-19 blood analysis 2021 data mild-severe-healthy
Target genes exposed with more than 1 CNV, having a 3 fold change in up regulation of severe compared to healthy cases, or a 60% decrease in expression in severe compared to healthy cases. With a scan for any linkage groups to be further studied as a group of genes affected by infected covid-19 patients

Body Effects of weight training, cardio, lipocavitation, using a waist trimmer, and dieting
Machine learning with basic linear model, preprocessing of data on research of dieting, exercise, lipocavitation, and using a waist trimmer for 21 days, with a diet that has no limits on what is eaten as long as not alcohol, not meat, not processed sweet, not added butter, and not gluten.
Analysis of six research studies to build a Tableau Dashboard to visualize gene expression variations in each study
This analysis uses dplyr and tidyr packages as well as some built in functions. You can get the files at https://github.com/JanJanJan2018/Six-Studies-Tableau-and-R- and view the dashboard at the bottom of this script in a link to an external window because its not viewable in the Rpubs browser. The research study access IDs are in the document.
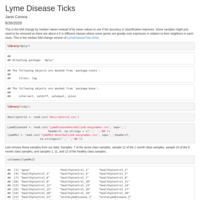
part2 of Lyme Disease document with GSE145974 data
This document is part 2 of the 'Lyme Disease Ticks' document using data from GEO GSE145974, but not the as is data, but a destandardized data scaled to try to inverse the log2 normalization, then extract the top genes having the most change in up or down regulation. The first part got to those genes and did machine learning on the mean values of the disease/treated to healthy samples as fold change values to filter the top genes. But accuracy was not good and some samples showed some skew or outlier behavior in some genes. This document extracted those six samples and used the median values of each class to get the fold change values to filter the top genes in up and down regulation, but still more samples don't behave the same within the genes. Machine learning was done and the mean value fold change derived genes scored better in the first part than these genes did by 10-14% overall accuracy. I will add on to part 1 to test the derived genes from the actual gene values without attempting to destandardize the values. I might add to this document to see how just a couple classes at a time does in prediction instead of four to derive some gene targets if they are in this set.
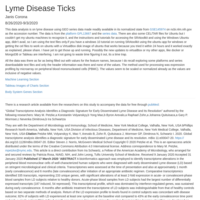
Lyme Disease Analysis GSE145974
This data was attempted to have it de-normalized or de-standardized, then add gene summary information to the top genes or bottom genes (up or down regulated) in disease or treatment to healthy mean values across all samples in each of the three classes of acute disease, 1 month antibiotics, or 6 months antibiotics. The genes that came out in the original log2 normalized versus the attempted inverse log2 normalized or de-standardized data were completely different genes. Machine learning will be added to see if one or both sets can predict with 96-97% accuracy the disease state as the research article published using this data has. All links are in the document.
June 21-Aug 17 Indeed data on selected jobs listed and average hourly advertised daily
The Indeed.com data on massage therapists (LMT), nannies, nurses, personal assistants, security, and warehouse workers fluctuating changes in number of jobs advertised or posted and average minimum salary advertise per day in each of 10 of the most populated cities in each state, with some further analysis of CA and some machine learning to predict the max hourly rate for the day based on the state, job, and minimum hourly rate using caret's lm or linear model, gbm (gradient boosted and regression models), rpart (recursive partitioned and regression trees), and caret's rpart version. Images are also shown of the interactive dashboard visualizations in Tableau Public Server to explore the data charts shown in the chart images of line charts, bar charts, stacked bar charts, and area charts.
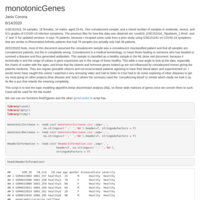
COVID-19 samples part 3 with only monotonic genes used
The GSE152418 data was used to test ML on the monotonically increasing or decreasing genes' fold change values from least to most severe COVID-19 samples is used here. The 10 most and least expressed values were used. Demonstrations Precision, Recall, and Accuracy within the classes, plus a function to return the table of those four classes' precision, recall, and accuracy within two machine learning models of linear discriminant allocation (lda) and random forest (rf). Originally wanted to show the 8800 genes as tokens to have the lda model predict on a training set of 24 and testing set of 9, but it failed, could be curse of dimensionality, or not setting the hyperparameters. LDA is built for wide and very wide data if its latent dirichlet allocation as the model designed for topic modeling on documents with 10,000+ words as features, but not in this script. Further analysis will need to be done on the model. It was the quick caret setting of the R lda training model. No plots, but maybe later scripts will add in the plots or extensions of this script. The LDA that was used was linear discriminant analysis and not on 8800 features, but 10 features.
COVID-19 (modified fold change rule) severity graded cases and gene expression analysis from GSE152418 of NCBI's GEO
same as last one, but changed the 0 rule in fold change if the disease state has 0 mean value and the healthy mean value is not 0, to 1-healthy mean value. Same results when filtering and running ML on. These are 20 genes, only the monotonically increasing or decreasing genes should be used for a 3rd run at prediction.
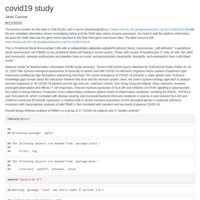
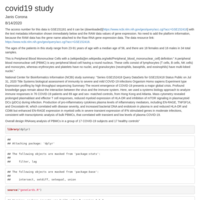
COVID-19 severity graded cases and gene expression analysis from GSE152418 of NCBI's GEO
This is actual COVID-19 gene expression analysis that sought the target genes that could differentiate the three different cases of COVID-19 and healthy samples from blood drawn from various aged patients and degrees of COVID-19 severity from moderate to severe to ICU degrees of the virus. Males and females also make up this data. The GEO repository for this series sample is GSE152418 with links in this document to that resource as well as the blog and the Tableau interactive charts exploring the fold change genes having the most change from disease to healthy states as a ratio. These genes change within the groups and the samples weren't large enough to get a good classification on the severity based on the top 20 genes having the most fold change in ICU to healthy mean values. Random forest, rpart, KNN, and LDA were used (LDA simulated the genes as tokens). Both age and gender were used in the predictors and without age and gender to compare. The results were improved in classification without including the age and gender demographics of each sample in a 70/30 train/test split with 34 total samples, 24 training and 9 testing the model. There isn't an equal balance of each case either, and all the moderate cases are females.

Rheumatoid Arthritis Patients' treatment effects with Machine Learning on RA genes
Genes selected from most fold change and least fold change values in gene expression means between groups of Rheumatoid Arthritis (RA) patients' blood being evaluated for treatment effects of abatacept in reducing interleukin 6 a painful inflammatory that effects COVID-19 patients' most critical symptoms to treat. The genes were extracted with disease to healthy ratios of fold change greatest and least valued in this group by gender, age, and overall by treatment. This is a study of NCBI GSE151161 with link in document. Machine learning with caret using random forests, k-nearest neighbors, latent dirichlet allocation, gradient boosted models, and generalized linear model of regression were used and compared on treatment classification. The genes selected were 100% accurate in classifying sample by gender but misclassified treatment type 5/76 times at best and misclassified 6/76 times at best on age. Possibly due to both weeks being treated with the treatment of abacept instead of just week12. There were two weeks tested, week0 and week12.
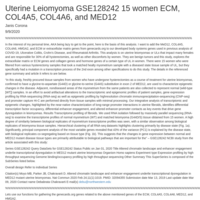
Genes Related to serous fluid in pericardium with fold changes in flu immunizations and UL
Using a previously defined set of functions and tables on UL and flu immunization data, this script explores the fold change values of uterine leiomyomas compared to healthy tissue and flu immunized samples after 1 and 7 days separately to their control of healthy non-immunized samples. The genes selected are the 10 out of 25 genes returned for 'serous fluid' from genecards.org. A brief explanation after every result is followed after each gene analyzed. Serous fluid is in the pericardium (heart cavity), the pleural cavity (lungs), and the abdominal/pelvic cavity (peritoneum). It is interesting to see the results of genes over and under expressed in comparing changes in body health.
Functions in R for gene expression fold change between treatment and control states
This is an extension to the previous document on ULs that returned a web scraped gene list for a protein entered and the three gene summaries from genecards.org. This one will also return the same fold change values from some flu immunized samples after 1 and 7 days as the treatment samples compared to healthy, non-immunized flu samples as a control.
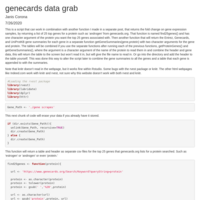
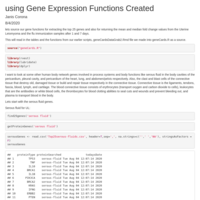
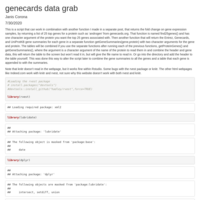
Genecards.org gene grabs for proteins interested in researching
The eval was set to FALSE within R when using knitr, but the code works great within my PC and using RStudio. I would have loved to show the ouput but unfortunately, the knitr default settings don't work with the rvest webscrape settings. I tried googling it, but got a couple insights that failed from that attempt. Maybe, later this can be fixed. The http error for 403 only pops up in knitting the document. These functions are very useful to getting the genes and gene summaries from Entrez/genecards/uniprotkb in comparing different samples of tissue for gene expression comparisons.

Analysis of States non-regulated for massage therapy
Use of the data available for market research on licensing for massage therapy and living costs like rent or mortgage, median annual pay per state, race distribution as a measure of diversity, advertised number of businesses and jobs for LMT available with advertised annual pay.
market research part 3 extended version of the partial 10 city and 3 city data
This has data on each state's number of jobs available, businesses listed online, the hourly/salary data on each job, race demographics, apartment prices for 2bed2bath and zillow multifamily median home values as well as median income from census data. File links in the script. Might not have complete set, but some alterations need to be done to the ones available like changing the name of the business type or job searched.
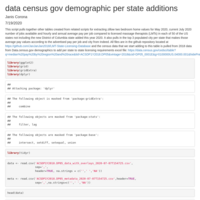
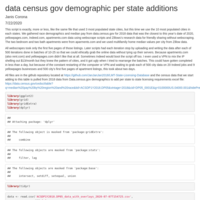
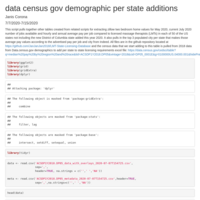
Data Analysis of states' Zillow home values, apartments.com rental values, indeed's advertised salaries, number of jobs available, and number of businesses from yellowpages.com and also demographics of each state
Very similar to the previous script most recently published, but with the indeed advertised salaries scraped from July 18th 2020, Zillow's 10 most populated cities of each state's home value for a two bedroom, the data.gov 2018 median income and state demographics, yellowpages.com's number of business listings from the 3 most populated cities for a selected type of business, apartments.com's rental listings for a two bedroom and 2 bath pet friendly apartment in the ten most populated cities of each state for July 19th, 2020, and the Zillow data was for June 2020 home values. There are some charts and comparisons. the files are found at the same github repo as posted in other similar script on LMT state licensing requirements.
LMT state by state comparison with number of jobs, pay, comparative jobs and demographics and home value per state
State by state comparison of LMT and comparative jobs available, pay rates, home values, demographics, using the three top populated cities per state, 2018 census data for added median income per state and race distributed diversity demographics with May 2020 two bedroom Zillow home values, and partial information on massage licensing in each of 50 states.
rvest improved indeed web scrape job title first 5 pages, salary info, days ago
a function that scrapes the first 5 web pages of indeed to return the listed job titles, hourly and/or salary information if available, number of days ago posted, and improved from last version that left some errors on salary columns.

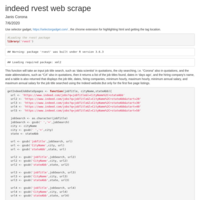
Rvest module to webscrape Indeed for a job title, city, state in first 5 pages
This script has a function designed to take the first five webpages that a user puts the "job title", "city name" and "state abbreviation" into it. The function is called getIndeedJobData5pages() where the three arguments need to be in quotes. Works for some cities, but a bug in Tampa FL search results. This was designed by me to help build the database for The Massage Negotiator that will share with the community the massage board requirements for state licensing of all 50 states, as well as the number of massage therapist jobs listed in up to the first five pages of a job search, with the minimum hourly and annual salary as well as the maximum hourly and annual salary per search, the days ago as dates, and the hiring company. The job description wasn't added to this function.
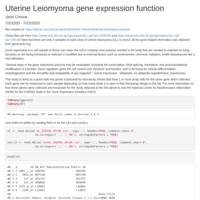
Gene Expression relationships in uterine leiomyomas or ULs
Analysis of fold change mean and median values of Uterine Leiomyoma (UL) microarray samples to nonUL samples totaling five each. The genes involved in protein production for iron, estrogen, adrenaline, testosterone, endorphines, alcohol catablosim, dopamine, vitamin D, calcium, striated muscle, cartilage and ligaments, collagen, fat production, and tumornecrosis factor are displayed using built function to pull the gene symbol from the data in quotes and return the mean and median values of the samples for each occurence of the gene in the microarray.
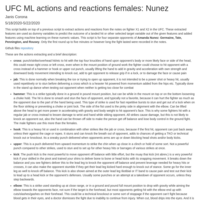
Feature Extraction for Machine Learning 4 fights with Amanda Nunez
From a previous script only 1/4 fights have the added wrestling but there are added features for total muay thai and push kicks instead of just kicks in previous scripts in github. Only 1st rounds taken and described, features extracted from the notes. To run ML on later to predict the X1 fighter of landing a hit based on cumulative sums, seconds gone by, and other actions/reactions of both X1 or opponent X2. files in the script's github link in the beginning. variables are described by what they are in the script,'l' landed,'r' received, and 'm' missed by X1 or X2 for those actions postpended to feature name, and up to 3 sequences of actions per second, with 300 seconds or 5-60second instances of each round if it lasted that long.
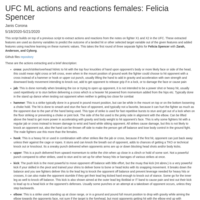
Feature Extraction for Machine Learning 3 fights with Felicia Spencer UFC
Extracting features of actions and reactions to run ML on hits landed as a target variable based on extracted features using R libraries for ML. Python used for CNN, DNN, and RNN as well as Multinomial Naive Bayes, Random Forest and Gradient Boosted Classifiers. In R, Random Forest, Generalized Linear Models, Gradient Boosted Models, Recursive Partitioned Trees, and K-Nearest Neighbor. Scored up to 100% accuracy with a couple of models. The trees and RNNs scored best.
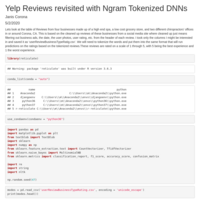
DNNs with TensorFlows Keras boot on revisited Social Media Reviews data
Deep Neural Networks using Keras in the TensorFlow version of python inside Rstudio. Reclassifies the data of reviews with 52,611 features of tokenized 1-3 grams (nltk module) of the reviews and classifies into 1-5 ratings based on those tokens. A couple different models used. Also scipy's Random Forest and Gradient Boosted trees to start out as a comparison.

Version 2 of first Massage Modality Recommender
Python 3 and R are used to build a program to recommend one of 19 modalities based on user input for excluding modalities contraindicated and recommending based on token to token comparison probabilities of the benefits or massage goals.

Massage Modality Recommender Systems
Core Massage Modalities and therapeutics totaling 19 different categories are recommended for a user based on his or her input, using a Random Forest Classifier and then a Gradient Boosted Classifier. Tokenized words were used for benefits into bigrams and contraindications into trigrams to better classify a good recommendation for a user. Python 3 is used inside Rstudio, with minor R coding, but the table is saved to csv. and found in the github repo at janjanjan2018 in the Health and Wellness Recommender folder.

Health and Wellness Recommender v8, RFC-GBC-MNB-ML algorithms
This version 8 of the Health and Wellness Recommender scores up to 100% accuracy on the testing set with Gradient Boosted Trees (150 with depth 11). On 82 observations with an 85% training set and 15% testing set. Other tuned models are shown with varying train/test splits. Random Forest, Gradient Boosted Trees, and Multinomial Naive Bayes. Python3 in R with reticulate package and sklearn, numpy, pandas, re (regex), string, and nltk python modules used. The results shown, defined recall and precision, gives 2 nmemonics to find use, confusion matrix of each train/test result, and predicted side by side to actual class categories. This set excludes the 'not professional' category and replaces with 'lymphatic drainage massage' and 'dry brushing massage' with the other categories: ER, chiropractic, physical therapy, cold stones, massage, massage gun, and mental health services. There are also functions after each set that test the stemmed and lemmatized tokens of the document term matrices in each model and split variation of each model to see what the predictor will be for each user input.
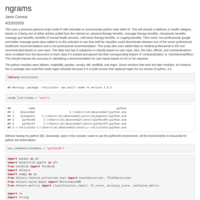
Three Tokenized forms Varying Train/Test splits and Trees with multinomial Naive Bayes to classify 9 categories
RStudio using python with reticultate package and other python packages to build some varying models with results from random forest, gradient boosted trees, and multinomial naive bayes. N-grams, count, and term frequency inverse document frequencey (TF-IDF) used with 80/20 and 85/15 train/test spit sets and trees set to 150 and depth at 11, to classify 9 categories involving health and wellness from documents that describe benefits of massage, cupping, cold stone therapy, chiropractic services, physical therapy services, ER services, massage gun services, and non professional requests from derogatory massage tweets. Performance varied with accuracy, recall, and precision results attached after each run. Single user input functions for these models was made for the ngram trees at the end of the script and the naive bayes at the beginning of script.

v6-recommederHealthCareServices-pyR
version 6 numerous n-grams 2-8. Best is 2-3


Version 4, Recommender for Healthcare Services
reticulate, python3, R, NLP, Textmining, wordclouds with unigrams and bigrams, count vectorization, tf-idf vectorization, and ngram vectorization. Added ER category and scrubbed risks and contraindications from the documents. Prediction accuracy actually went down.

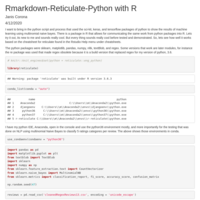
NLP-RecommenderSystem-Healthcare-Version3-reticulate-python3-R
Third version of recommender system in R with python3 using reticulate. This version has an added non-pro class category to classify the user input along with the other 7 healthcare services recommendations.

Reticulate for NLP using Python in R with added word clouds of Recommended Healthcare Options
Recommended healthcare option for user to choose between modalities of massage, physical therapy, mental health services, or chiropractice services. This is the same as the other Reticulate recommender system but with the added word clouds for highest bigram word pairs in each category.

Massage Modality or Alternate Healthcare Recommender System
Based on user input, this recommender system will recommend either massage therapy, massage gun therapy, cold stone therapy, cupping, chiropractic therapy, physical therapy, or mental health therapy.
Python 3.6 inside of Rstudio using Reticulate, for Multinomial Naive Bayes ML Sentiment Analysis
This shows the use of the reticulate library within Rstudio for an Rmarkdown file to demonstrate the multinomial naive bayes sentiment analysis done in python 3.6 for predicting a rating 1-5 on reviews and manually entered reviews.
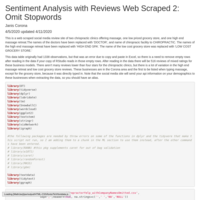
Web Scraped Reviews 2, Text Mining, NLP, ML, visNetworks, predict with Selected Keys
Version 2 with some modifications to the original 12 stopwords as keywords, without and with 12 additional keywords picked by meeting certain thresholds. R packages used: dplyr, tidyr, tm, wordcloud, ggplot2, visNetworks, igraph, caret, randomForest, MASS, gbm, etc. Python script was also compared with sklearn and keras multinomial naive bayes predictions of ratings 1-5 based on reviews TextBlob tokenized to manually predict each statement entered or to make the usual automated predictions with the testing set. Tidytext was used as well to tokenize and compare bigrams selected as features to predict in R. Lexicons in Tidytext of NRC, Bing, AFINN, and Loughran were used as scoring and counting features to make predictions on ratings from the tidytext, tm, and other R text mining packages.
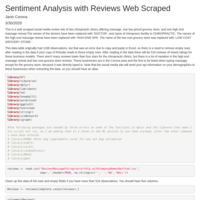
Web Scraped Reviews with Manual NLP with regex and keyword extraction to predict Rating by Review
This Rmarkdown file demonstrates how to clean data with regular expressions (regex) for feature extraction from the reviews and use of natural language processing (nlp) without use of the algorithms applied to the document term matrix (dtm) to predict the rating. It manually breaks down the process of building and re-running a script to predict the most likely rating based on 12 keywords and ratios of term to total term frequency.
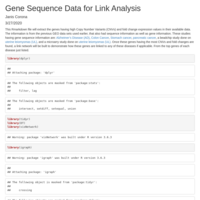
Gene Targets by Threshold CNV and Fold Change Values Link Analysis with VisNetwork
Six diseases that were extracted from GEO databases and had sequence information, were analyzed by targeting those genes that had high copy number variations and were either in the lowest 5th or highest 95th percentile. Those genes were then analyzed for multiple gene associations and plotted in a link analysis plot with the genes the nodes and the diseases the centroid nodes associated with those genes. There are interactive data tables of findings, complete documented steps to reproduce, and a great interactive visNetwork link analysis plot at the end.
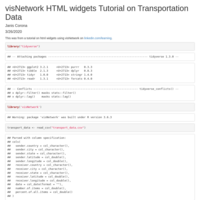
Link Analysis Setting up a Link Network VisNetwork Htmlwidgets
The htmlwidgets R linked in learning course on visNetworks. This used the data table provided and code, some modifications. This shows how the data tables can be modified to presumably use on other datasets. Like for use on gene expression values for genes in common with other diseases or fold changes, or stocks that have majority businesses in certain regions and how they do when some of those businesses default or are insolvent. Many uses for this handy interactive tool. The plot at the end is interactive, with zoom, labels visualized, highlighting of nodes, ets. You are encouraged to try it out, get familiar with it, and use it on analyzing other data you have.
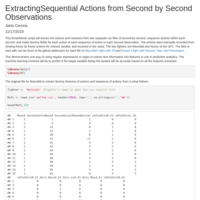
Regex extraction from notes of seconds of time for actions in UFC Mazvidal
UFC fighter script in Rmarkdown that shows use of regular expression (regex) to extract the sequential actions of fighters in the UFC. This one uses Mazvidal from frame by frame notes on actions and reactions of Mazvidal and Till in Europe. Designed to be used in Machine Learning (ML) for predicting hits landed based on hits received, missed, landed in event.
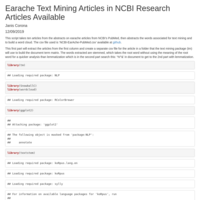
Text Mining PubMed Articles on Earaches
This Rmarkdown file shows how the stemming and lemmatization of the document term matrix of text mined words from ten articles extracted from PubMed differ with some word clouds showing the most common words in the documents after they have been cleaned.
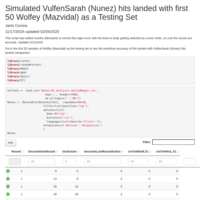
UFC fighter analytics, ML on hits landed from regex text extraction of descriptive actions
This takes a few of the samples of fights from aliases VufenSarah (A.Nunez) and Wolfey (Mazvidal) and predicts any sequence of up to three in one observation as one second of a particular fighting round as a hit landed, missed, received and what type of action. Does not include ground actions in predictions as features (actions/reactions). The algorithms used vary and predict around 85% accuracy on if that second will be a hit landed based on the chosen features that were selected to exclude multicollinear features.

Coronavirus liver tumor and blood capillary samples analyzed for CNVs and such
This is not the current COVID-19 strain, but the more recent coronavirus from 2017-2019. This Rmarkdown file combines the gene expression values obtained from a NCBI database to look at genes with more Copy Number Variations (CNVs) and fold change of strains over time from one day in one study and 4 days for the other study. These are beadchip gene expression values.
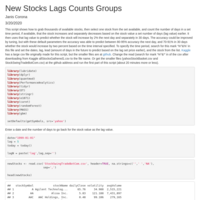
grabbing the stocks available from yahoo to Analyze and calculating counts decreasing and increasing
This program grabs the stocks pulled from the web and available by ticker symbol at yahoo finance, it then uses all the information from a set date up until todays date and adds the lag value lag days earlier to get the counts of increasing and decreasing days by lag and saves to file with date retrieved and current date and lag value.
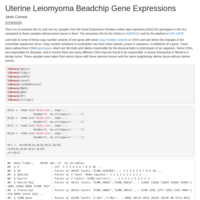
Uterine Leiomyoma Beadchip Gene Expressions MySQL and DT package
Use of the DT and RMariaDb packages to display the table of copy number variants (CNVs) and fold change values as a ratio of the mean of Uterine Leiomyoma (UL) to the mean of nonUL. The top CNVs and fold change genes were displayed from a call to the MySQL database to use SQL queries.
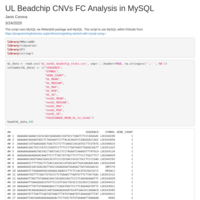
Uterine Leiomyoma Beadchip CNVs and FCs with ML to Predict Gene Targets
A machine learning script on uterine leiomyoma (UL)beadchip data from NCBI GEO that shows copy number variants (CNV) of each gene and fold change (FC) gene expressions as subsets of most CNVs and FCs of genes to use as gene predictors of having UL or not.
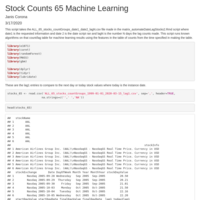
Subset of Stock with ML for Days Increasing or Decreasing as Target
Time series of selected stocks with a subset single stock selected from a data set of 65 stocks with added counts for days the stock increased or decreased and how many times in the given time period calculated did the stock exactly increase or decrease that many days. As well as predicting a target of next day being an increasing or decreasing day from price a set lag days made when calculating the counts.