
iangow
Ian Gow
Recently Published

Data management ideas for researchers
My sense is that data management is a challenge for researchers. In an academic context, some fields may receive greater institutional support than others. My experience in business schools was that there was very little support for data curation and management. While many of the ideas I discuss here are general in nature, for concreteness, I focus on the special case of a WRDS user maintaining a local Parquet data library of the kind discussed in Appendix E of Empirical Research in Accounting: Tools and Methods and provide examples using my Python package db2pq.

metric_2024
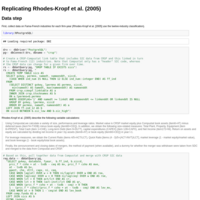
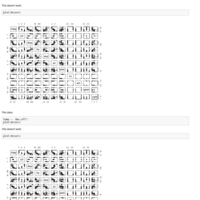
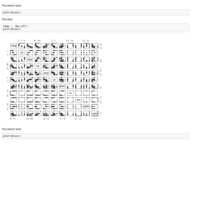
A short note showing how to replicate analyses from Metrick (2024).

Reproducible data collection
An exercise I have assigned to students in the past is to go to the online supplements and datasheets page for the Journal of Accounting Research, pick an issue of the journal and evaluate whether one could reproduce the analysis in the associated paper using the materials made available there. Generally, the answer has been negative. That said, it seems that the Journal of Accounting Research is still the (relative) leader among accounting-focused academic journals with regard to requiring authors to supply materials. In this note I show how data collection can be made more reproducible.

Shared code
Open-source software dominates in certain areas. A lot of data science relies on thousands of open-source packages that are continually being improved in part because anyone can see how they work. Yet the open-source model has not taken off in academia. A lot of the publicly available code in accounting research relates to two seemingly obscure topics: Fama-French industries and winsorization. I discuss both in this note.

Some benchmarks with comp.g_secd
I use the WRDS data set `comp.g_secd` to do some benchmarking. A representative query that takes 6 minutes using SAS on the WRDS servers, takes about 1 minute using the WRDS PostgreSQL server, and about 0.2 seconds using a local parquet file. The parquet file occupies less than 4 GB on my hard drive, which compares with about 145 GB for the SAS file on the WRDS server. While creating the parquet file takes 45 minutes, this may be a reasonable trade-off for a researcher who is analysing `comp.g_secd` frequently and does not need the very latest iteration of `comp.g_secd` for research purposes.

The best of both worlds: Using modern data frame libraries to create pandas data
A number of modern data frame libraries have emerged that address weaknesses of pandas. In this note, I use polars and Ibis to show how one can use these libraries to get the data into a form in which pandas can shine.

Using SAS to create pandas data
SAS might be another approach to manipulating data for pandas. My Python package wrds2pg offers a sas_to_pandas() function that can run code on the WRDS server and return the results as a pandas dataframe. While not quite as fast as using Ibis with the PostgreSQL server, SAS performs pretty well with this task.

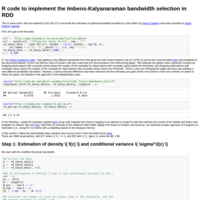
Data curation: The case of Call Reports
I recently (Gow, 2026) proposed an extension to the data science “whole game” of R for Data Science (Wickham et al., 2023). In Gow (2026), I used Australian stock price data to illustrate the data curation process and, in this note, I use US bank “Call Report” data as a second illustration. In effect, I provide complete instructions for building a high-performance data library covering all Call Reports data provided by the FFIEC Bulk Data website that can be construction in less than ten minutes on fast hardware (or a couple of hours on an older machine). I also give a few brief demonstrations of how to use the curated data, with examples for both R and Python. I conclude by discussing challenges encountered during processing and offering some observations about AI and data curation.

Responsive open-source software: Two examples from dbplyr
In this note, I explore some recent changes in the open-source R package dbplyr to illustrate some of the beauty of how open-source software evolves in practice. In particular, I offer two case studies where features requested by users became reality in dbplyr, which may be my favourite R package.
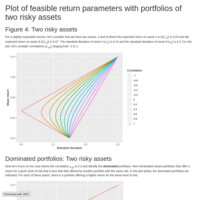
Two risky assets
Plot of feasible return parameters with portfolios of two risky assets
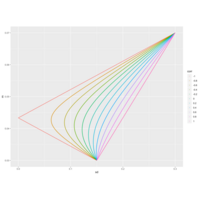
Plot
Plot of feasible portfolio returns given two risky assets by correlation
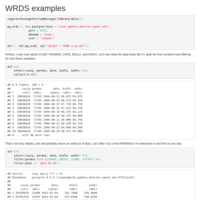
WRDS examples
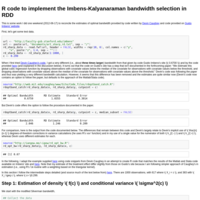
R code to replicate examples from [here](https://wrds-web.wharton.upenn.edu/wrds/support/Accessing%20and%20Manipulating%20the%20Data/_007R%20Programming/_001Using%20R%20with%20WRDS.cfm).
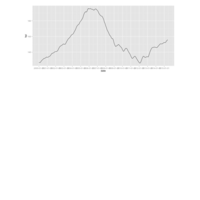
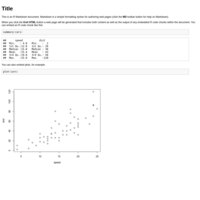
Publish Plot
House prices over time


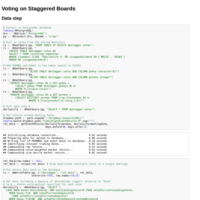
Title
Test