
gmbeisbol
Gráficos y Métricas
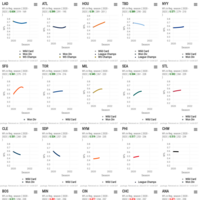
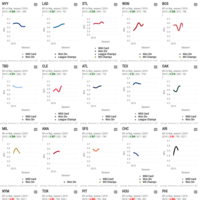
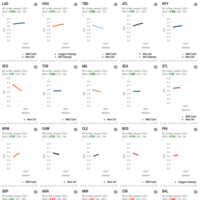
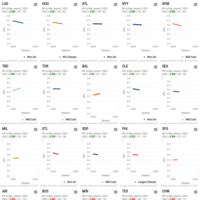
Recently Published

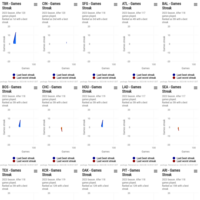
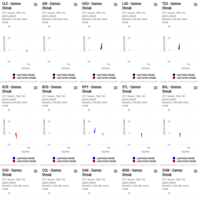
2025 MLB Team's Streak
Visualization of the 2025 MLB Season Winning and Losing streaks for all the teams, sorted in descending order based on best Winning Streak.

2025 AL Teams Winning Percentage
Winning percentage of MLB AL teams through the 2025 season.

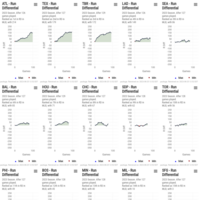
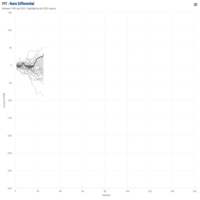
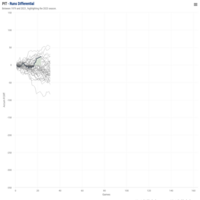
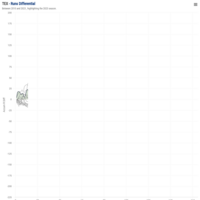
2025 MLB Team's Run differential
Visualization of the 2025 MLB Season Run Differential, for all the teams, sorted in descending order.

2024 MLB Team's Run differential
Visualization of the 2024 MLB Season Run Differential, for all the teams, sorted in descending order.

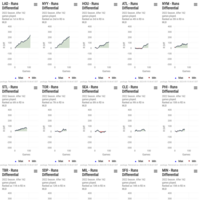
Milwaukee Brewers Runs Differential
This chart show the TBR RD between the 2010 Season and 2024

2024 MLB Team's Run differential vs Winning percentage
Visualization of the 2024 MLB Season Run Differential (RD), for all the teams, versus their Winning Percentage (W%).

2024 MLB Teams - Run Differential vs Winning %
Scatter plot of RD (x Axis) vs W% (y Axis) of all MLB teams in the 2024 season

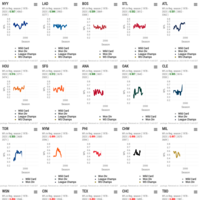
2024 MLB Team's Streaks
Visualization of the 2024 MLB Season Winning and Losing streaks for all the teams, sorted in descending order based on best Winning Streak.
2023 MLB Team's Run differential
Visualization of the 2023 MLB Season Run Differential, for all the teams, sorted in descending order.
2023 MLB Team's Streaks
Visualization of the 2023 MLB Season Winning and Losing streaks for all the teams, sorted in descending order based on best Winning Streak.
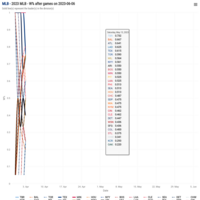
Reg Season W% of MLB teams from 1978 to 2023
Visualization of the Reg. Season W% of MLB teams from 1978 until 2023.
Teams are sorted in descending order by the W% in the whole period.
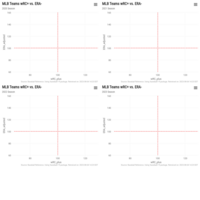
wRC+ vs ERA- From 2020 to 2023
Scatter plot of wRC+ (x Axis) vs ERA- (y Axis) of all MLB teams from 2020 to 2023 season (through 03/08)
Reg Season W% of MLB teams from 2020 to 2023
Visualization of the Reg. Season W% of MLB teams from 2020 until 2023.
Teams are sorted in descending order by the W% in the whole period.
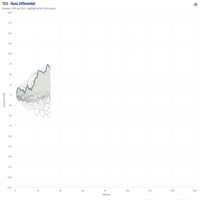
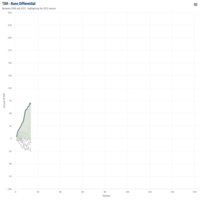
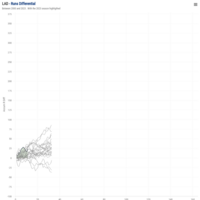
Texas Rangers Runs Differential
This chart show the TBR RD between the 1990 Season and 2023
2017 MLB Team's Streaks
Visualization of the 2017 MLB Season Winning and Losing streaks for all the teams, sorted in descending order based on best Winning Streak.
Reg Season W% of MLB teams from 2010 to 2019
Visualization of the Reg. Season W% of MLB teams from 2010 until 2019.
Teams are sorted in descending order by the W% in the whole period.
Reg Season W% of MLB teams from 2021 to 2023
Visualization of the Reg. Season W% of MLB teams from 2021 until 2023.
Teams are sorted in descending order by the W% in the whole period.
Reg Season W% of MLB teams from 2022 to 2023
Visualization of the Reg. Season W% of MLB teams from 2022 until 2023.
Teams are sorted in descending order by the W% in the whole period.
2023 MLB Teams Winning Percentage
Winning percentage of MLB teams through the 2023 season.
Pittsburgh Run Differential
This chart show the PIT RD between the 1990 Season and 2023
Tampa Bay Rays Runs Differential
This chart show the TBR RD between the 2008 Season and 2023
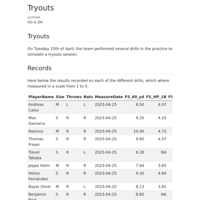
Fielding results 1st Tryout
25/04/2023
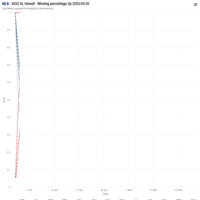
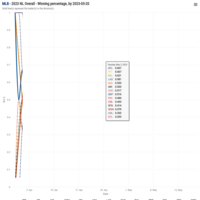
2023 MLB AL Overall Winning Percentage
Winning percentage of MLB teams in the American League through the 2023 season.
2023 MLB NL Overall Winning Percentage
Winning percentage of MLB teams in the National League through the 2023 season.
2022 MLB Runs diferential
Visualization of the 2022 MLB Season Runs Differential, for all the teams, in descending order.
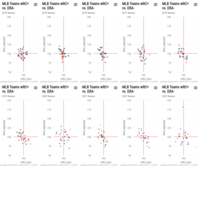
wRC+ vs ERA- From 2014 to 2023
Scatter plot of wRC+ (x Axis) vs ERA- (y Axis) of all MLB teams in the last decade, including 2023 season (through 12/05)
Foot Speed density charts
For times measured on 25/04/2023
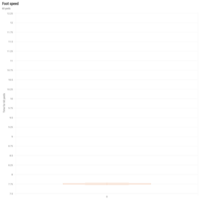
Foot Speed in 60 yards
In 60 yards on 25/04/2023
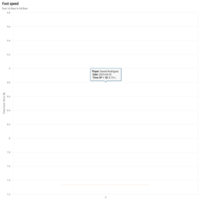
Foot Speed 1B to 3B
From First Base to Third Base on 25/04/2023
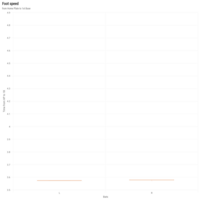
Foot Speed HP to 1B
From Home Plate to First Base on 25/04/2023, split by batting hand
Pittsburgh Runs Differential
This chart show the PIT RD between the 1979 Season and 2023
Texas Rangers Runs Differential
This chart show the TBR RD between the 2010 Season and 2023
Los Angeles Dodgers Runs Differential
This chart show the LAD RD between the 2000 Season and 2023.
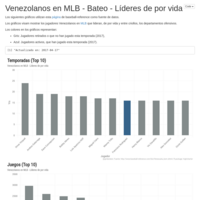
MLB - Líderes Venezolanos de por vida (Bateo)
Gráficos representando los líderes criollos en la MLB