
emmanuel2017
Bakare Emmanuel Afolabi
Recently Published


HTML
We show the estimated disease risk in an interactive map using leaflet. In the map, we add labels that appear when mouse hovers over the counties showing information about observed and expected counts, SMRs, smokers proportions, RRs, and lower and upper limits of 95% credible intervals.

HTML
We can improve the map by highlighting the counties when the mouse hovers over them, and showing information about the observed and expected counts, SMRs, and smoking proportions.

HTML
We can visualize the observed and expected disease counts, the SMRs, as well as the smokers proportions in an interactive chropleth map. We construct this map using the leaflet package.

HTML
We can visualize the observed and expected disease counts, the SMRs, as well as the smokers proportions in an interactive chropleth map. We construct this map using the leaflet package.
Publish Document
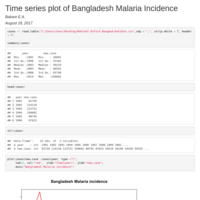
Annual Bangladesh Plasmodium falciparum Malaria incidence
Publish Document
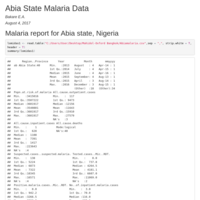
Time series plot of Abia State Malaria Incidence
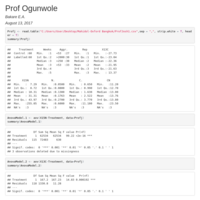
Analysis of Variance
Analysis of Variance