
eamille91
Elizabeth
Recently Published
Plot
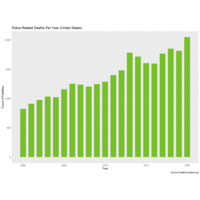
FE by year
Plot
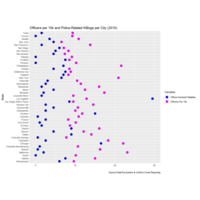
officers & oif source ucr


Plot
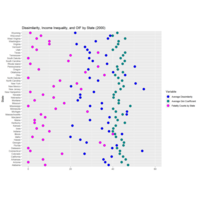
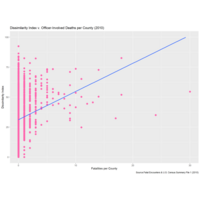
dissim& OIF
Plot
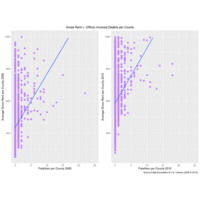
grossrent & OIF
Plot
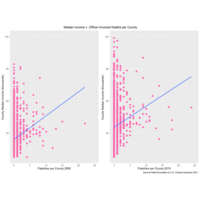
medinc & oif
Plot
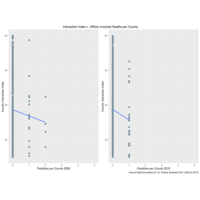
Interaction and OIF

Plot
.
Plot
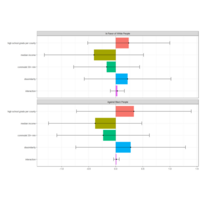
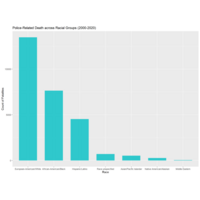
This shows that the outcome of officer-involved fatalities is mostly explained by racial differences between Black and White individuals, but some of that difference is explained by other explanatory variables (at least for group B, which is Black people)
Plot
oaxaca attempt 1

Plot
fixed
Plot
plotplotploooot
Plot
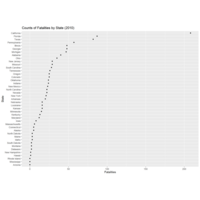
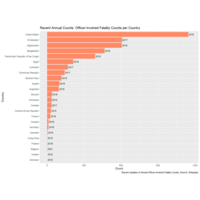
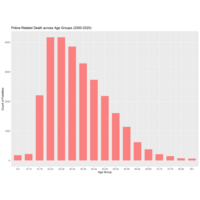
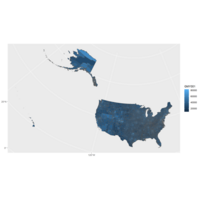
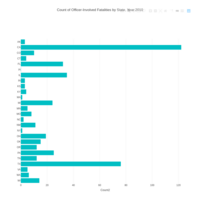
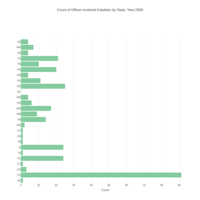
fatality counts per state
Plot
title is cut off

Plot
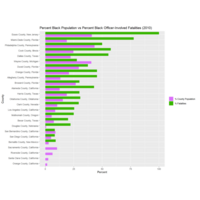
corrected10blk
Plot
coorectedblk00

Plot
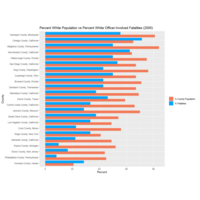
2000wht

Plot
white2010

Plot
GROSSRENT10

Plot
GROSSRENT00

Plot
2000
Plot
2010
Plot
plotplotplot
Plot
CHART%
Plot
chart10
Plot
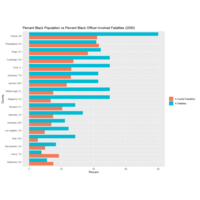
by race
Plot
comparison
Plot
Officer-Involved Fatalities: 2000 vs 2010
Plot
sig plot
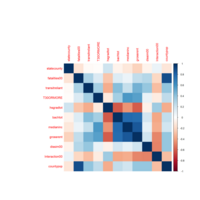
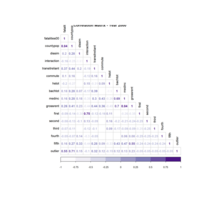
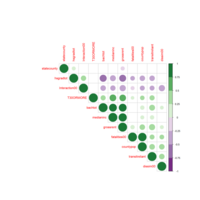
corrplot_1
correlations plot 2000
Plot
colors! Not sure what I'm looking at.
Plot
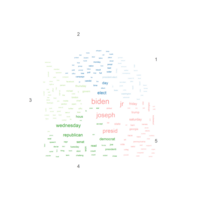
2nd wc
Plot
2nd word cloud
Plot
median income 2000 (source: sf3 census filings)
Plot
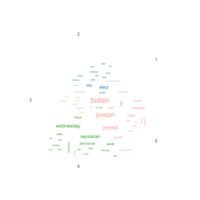
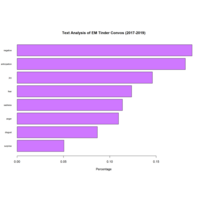
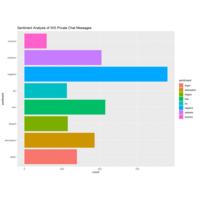
t_chats
Plot
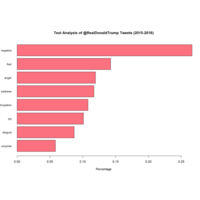
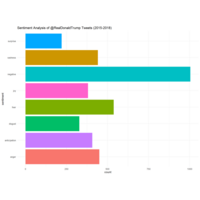
trump_tweets_chart1

HTML
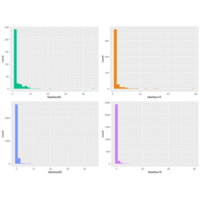
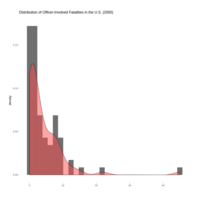
density plot

HTML
2010 histogram

HTML
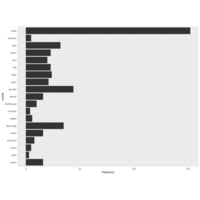
fatality freq 2000
HTML
bar chart 2010
HTML
bar chart