
claudiotorres
Claudio Torres Casanelli
Recently Published
Next Word Prediction - Capstone
This work is a specially designed application that is able to predict next word when you are writing in english. It allows you to be aware of what are the most common words that comes after the text you are writing. This present application works for the English language, but it could work for any language you like. I have tested in spanish with wonderful results.
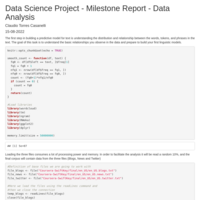
Data Science Capstone - Task 2 - Exploratory Data Analysis
The first step in building a predictive model for text is understanding the distribution and relationship between the words, tokens, and phrases in the text. The goal of this task is to understand the basic relationships you observe in the data and prepare to build your first linguistic models.


Covid in Chile Presentation
Covid in Chile
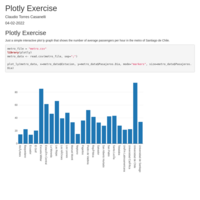
Plotly - Passengers in line 1 of Metro Santiago Chile
Just a simple interactive plot ly graph that shows the number of average passengers per hour in the metro of Santiago de Chile.
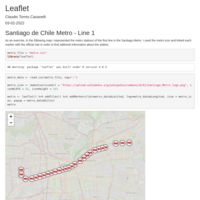
Leaflet - Stations from line 1 of Metro of Santiago
As an exercise, in the following map I represented the metro stations of the first line in the Santiago Metro. I used the metro icon and linked each marker with the official site in order to find additional information about the station.
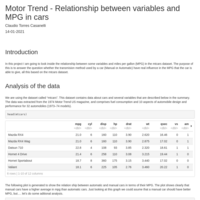
Motor Trend - Relationship between variables and MPG in cars
In this project I am going to look inside the relationship between some variables and miles per gallon (MPG) in the mtcars dataset. The purpose of this is to answer the question whether the transmision method used by a car (Manual or Automatic) have real influence in the MPG that the car is able to give, all this based on the mtcars dataset.
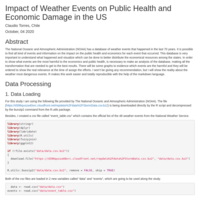
Impact of Weather Events on Public Health and Economic Damage in the US
The National Oceanic and Atmospheric Administration (NOAA) has a database of weather events that happened in the last 70 years. It is possible to find all kind of events and information on the impact on the public health and economics for each event that occurred. This database is very important to understand what happened and visualize which can be done to better distribute the economical resources among the states. In order to show what events are the most harmful to the economics and public health, is necessary to make an analysis of the database, making all the transformation that are needed to get to the best results. There will be some graphs to evidence which events are the harmful and they will be ordered to show the real relevance at the time of assign the efforts. I won't be giving any recommendation, but I will show the reality about the weather most dangerous events. R makes this work easier and totally reproducible with the help of the markdown language.