
boyd-chris
Boyd Christopher
Recently Published

Capstone Project Documentation
This project predicts next possible word for a phrase
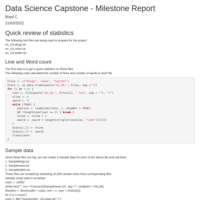
Data Science Capstone - Milestone Report
Brief statistics of data
Sample data prepared
Simple analysis of sample data

Developing Data Product - Presentation
This presentation briefly explains the Shiny interactive plot
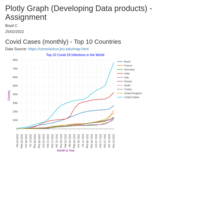
Plotly Graph (Developing Data products) - Assignment
Collected Covid-19 data from April 2020. Calculated monthly average and created plot using this data for top 10 infected countries.
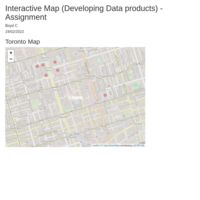
Interactive Map (Developing Data products) - Assignment
Toronto City map with popup logo
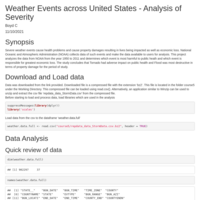
Reproducible Research - Assignment 2
Analysis of NOAA weather data from 1950 to 2011 to determine the weather event which is most harmful to public health and which is responsible for greatest property damage