alok_pratap_
Alok Pratap Singh, PhD Scholar (Psychology), University of Allahabad
Recently Published
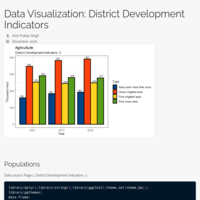
Data Visualization: District Development Indicators
Plot, Line Plot, & Lollipop Plot
(Assignment)
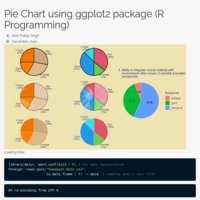
Pie Chart using base R & ggplot2 package (R Programming)
Survey Work
(Assignment)

Image Processing: Automatic Certificate Generation using R
Automatic Certificate Generation Using "R Programming"
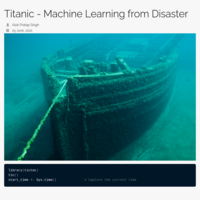
Titanic - Machine Learning from Disaster
To build a predictive model that answers the question: “what sorts of people were more likely to survive?
Data analysis of World Happiness Report
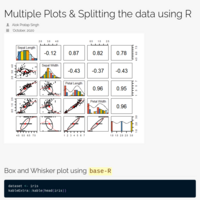
Multiple/ Stepwise regression is used for modelling and prediction
(Assignment)
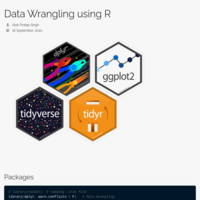
Data Wrangling using R
(Assignment)