
Thom_JH
Thomas J. Haslam
Recently Published
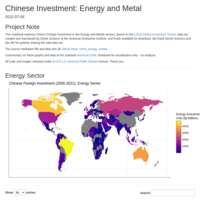
Chinese Investment: Energy and Metal
This notebook explores China’s Foreign Investment in the Energy and Metals sectors, based on the China Global Investment Tracker data set, created and maintained by Derek Scissors at the American Enterprise Institute, and freely available for download.
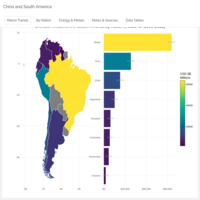
China and South America: Tracking Chinese Investment
This dashboard explores China’s investment in South America, based on the China Global Investment Tracker data set, created and maintained by Derek Scissors at the American Enterprise Institute, and freely available for download. China, according to the Belt and Road Research Platform, is either the number one or number two trade partner for the majority of South American nations. In fact, in terms of economic hegemony, Bloomberg News (18 February 2022) has already conceded South America to China: “How China Beat Out the U.S. to Dominate South America.” Although history is obviously still being written, the data does support this claim.
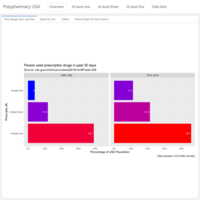
Polypharmacy USA
This project explores explores the usage of prescription drugs in the USA as reported by the CDC in “Table 39. Prescription drug use in the past 30 days, by sex, race and Hispanic origin, and age: United States, selected years 1988–1994 through 2015–2018.” The data shows over time a disturbing prevalence towards polypharmacy: the “use of multiple medications by a patient.” This prevalence is consistent across all four Age Groups in the data set: Under 18, 18-44, 45-64, and 65 & older.
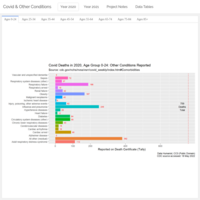
Covid & Comorbidities for 2020 & 2021
Based on the American CDC data. The new CDC language is “deaths involving coronavirus disease 2019.” For over 5% of deaths, only the only condition reported was Covid. For the remaining (94% +), an average "4.0 additional conditions or causes per death." This dashboard visualizes the deaths per Condition, Age Group, and Year.
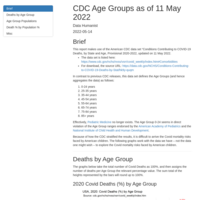
CDC Age Groups as of 11 May 2022
This report makes use of the American CDC data set “Conditions Contributing to COVID-19 Deaths, by State and Age, Provisional 2020-2022, updated on 11 May 2022. The Age Group 0-24 seems in direct violation of the Age Group ranges endorsed by the American Academy of Pediatrics and the National Institute of Child Health and Human Development. Because of how the CDC stratified the results, it is difficult to arrive the Covid mortality risks faced by American children. The following graphs work with the data we have – not the data one might wish – to explore the Covid mortality risks faced by American children
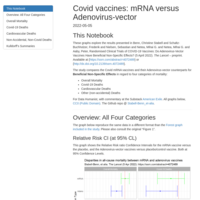
Covid Vaccines: mRNA versus Adenovirus-vector
This notebook explores the results presented in Benn, Christine Stabell and Schaltz-Buchholzer, Frederik and Nielsen, Sebastian and Netea, Mihai G. and Netea, Mihai G. and Aaby, Peter, Randomised Clinical Trials of COVID-19 Vaccines: Do Adenovirus-Vector Vaccines Have Beneficial Non-Specific Effects? (5 April 2022). The Lancet – preprint. Available at {https://ssrn.com/abstract=4072489} or {http://dx.doi.org/10.2139/ssrn.4072489}.
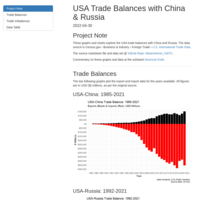
USA Trade Balances with China & Russia
Visualizations that explore the USA economic relationship with China, and with Russia. Based on US Gov. data.
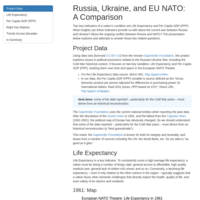
Russia, Ukraine, and EU NATO: A Comparison
Two key indicators of a nation’s condition are Life Expectancy and Per Capita GDP (PPP). What insights can these indicators provide us with about the current war between Russia and Ukraine? About the ongoing conflict between Russia and NATO? The presentation below explores and attempts to answer those two related questions.
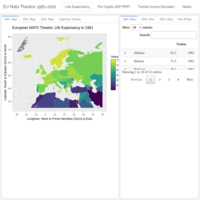
EU NATO Theatre: 1961-2021
This dashboard explores the European NATO theatre in terms of Life Expectancy and Per Capita GDP (PPP) for the years 1961 to 2021, with two additional focused studies of eight key nations from 1949, NATO's founding, to 2021. After examining all the evidence, I conclude as follows: the data shows Russia has been in steep decline. Hence we need to update our thinking, world-view, and policies accordingly. Understanding that Russia is in decline provides much needed context both for dealing with with Putin’s desperate invasion of Ukraine, and for assessing Russia’s future threat potential.
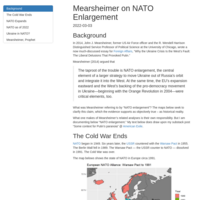
Mearsheimer on NATO Enlargement
In 2014, John J. Mearsheimer argued: "The taproot of the trouble is NATO enlargement, the central element of a larger strategy to move Ukraine out of Russia’s orbit and integrate it into the West." What was Mearsheimer referring to by “NATO enlargement”? The maps below seek to clarify this claim, which the evidence supports as objectively true – as historical reality.
TSD_example_2022
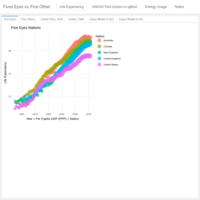
A dashboard example for my students. The Five Eyes nations are Australia, Canada, New Zealand, the United Kingdom, and the United States. The Five Other nations for this comparison are Italy, Japan, Mexico, Norway, and Russia. We are looking at Life Expectancy and related concerns, using data from Gapminder.org
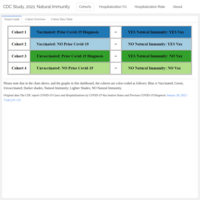
CDC Study, 2021: Natural Immunity
Based on the CDC report, “COVID-19 Cases and Hospitalizations by COVID-19 Vaccination Status and Previous COVID-19 Diagnosis — California and New York, May–November.” (January 28, 2022 / 71(4);125–131). A more detailed look at the Natural Immunity — Unvaccinated Cohort (#3) versus the “Fully Vaccinated” Cohorts ( #1) & (#2).
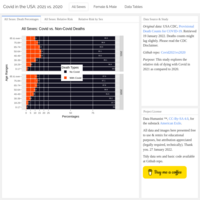
Covid in the USA: 2021 vs. 2020
Based on CDC data (USA), this study explores the relative risk of dying with Covid in 2021 as compared to 2020.
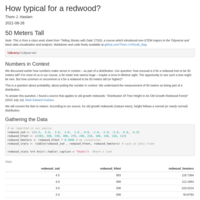
How typical for a redwood?
How unusual is it for a redwood tree to be 50 meters tall? This was our class question, and here's one way to answer it.
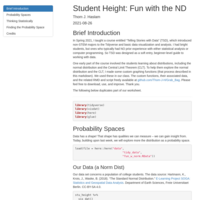
Student Height: Fun with the ND
Exploring the Normal Distribution and the Central Limit Theorem using customized graphing functions. A worksheet example for people new to R and Stats.
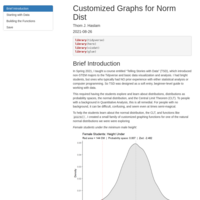
Customized Graphs for Normal Distribution
A small family of customized graphing functions exploring the normal distribution and the CLT.
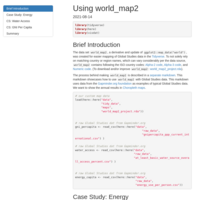
Using world_map2
This markdown showcases how to use world_map2 with Global Studies data., with data from the Gapminder.org foundation as typical examples. The graphs show the annual results in Choropleth maps.
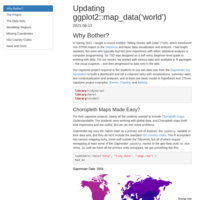
Updating ggplot2::map_data(‘world’)
Updates ggplot2::map_data("world") by adding the standard ISO country codes: Alpha-2 code, Alpha-3 code, and Numeric code. Also, makes the short version country names largely compatible with the Gapminder.org country names.
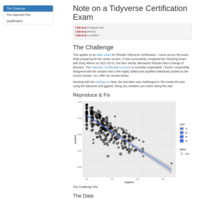
Tidyverse Exam Note
This applies to an older exam for RStudio Tidyverse Certification.
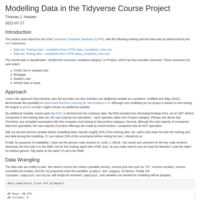
Modelling Data in the Tidyverse
Final Project Report for the JHU Coursera specialization Tidyverse Skills for Data Science.
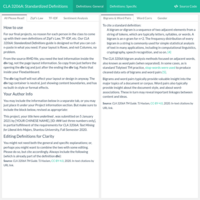
CLA 3206A: Standardized Definitions
A glossary for CLA 3206A: Text Mining for Liberal Art
Majors, Fall Semester 2020, STU.