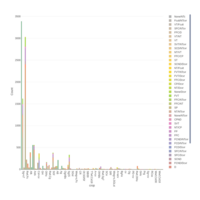
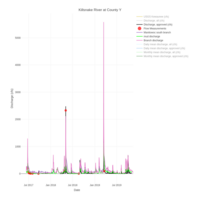
NEL_2020
Kim Oldenborg
Recently Published


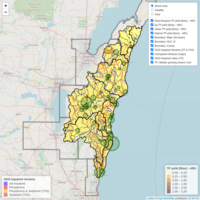
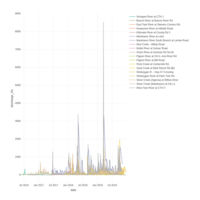
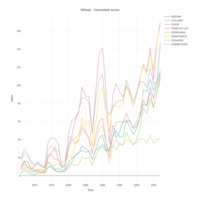
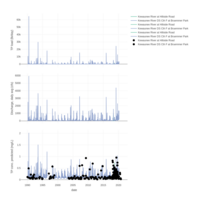
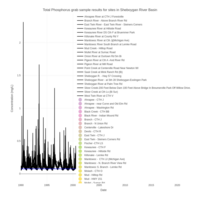
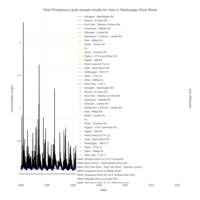
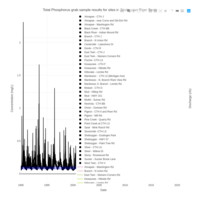
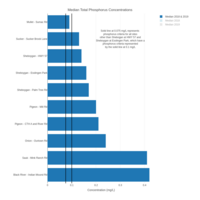
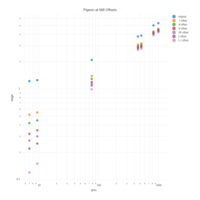
TP yields
HRU output
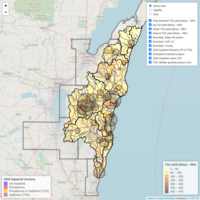
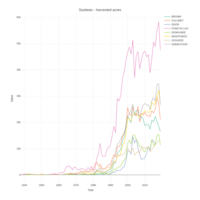
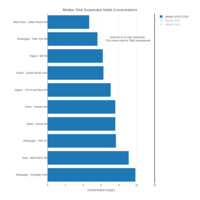
TSS yields
HRU output
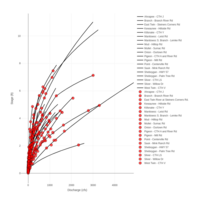
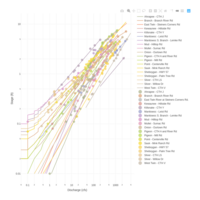
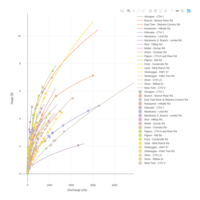
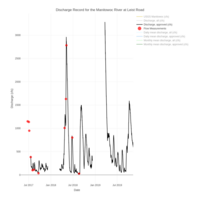
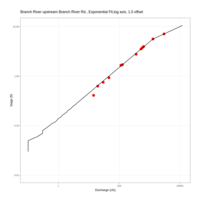
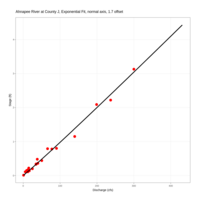
rating curves, normal
no winter extrapolation
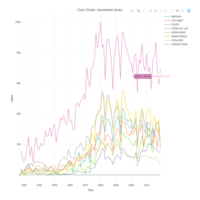
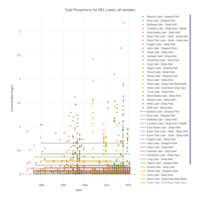
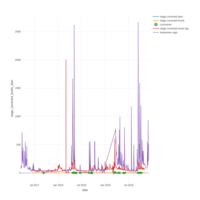
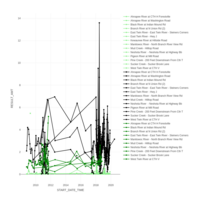
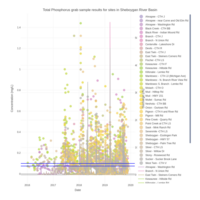
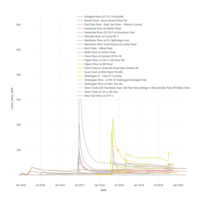
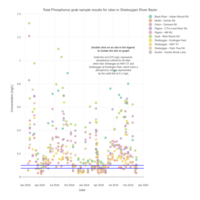
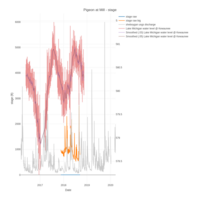
TP for NEL lakes, all samples
Bottom samples have attempted to be removed. Includes samples from June 1 - Sept 30. Averages calculated with data shown on chart.
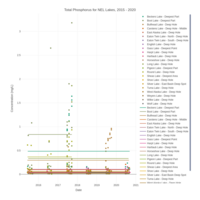
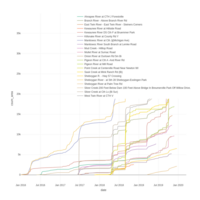
TP for NEL Lakes, 2015 - 2020
Bottom samples have attempted to be removed. Includes samples from June 1 - Sept 30. Averages calculated with data shown on chart.
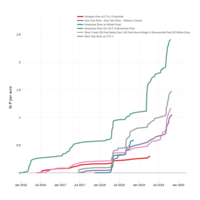

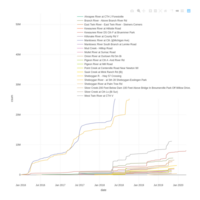
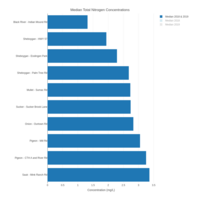
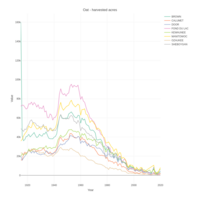
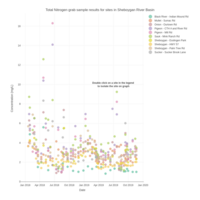
Median Nitrogen concentration - Sheboygan river basin
Includes all samples taken through out the year
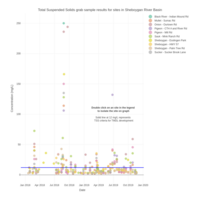
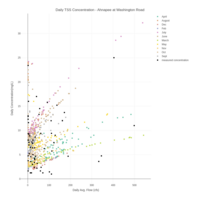
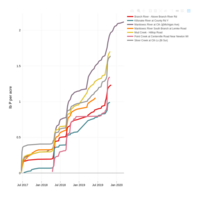
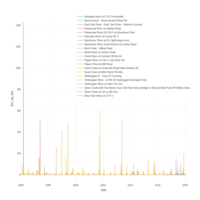
Median TSS - Sheboygan Basin
Includes all samples taken through out the year
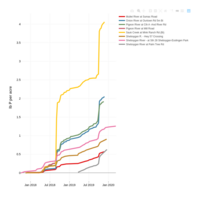
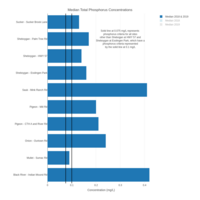
Median TP concentrations - Sheboygan Basin
Includes all samples taken through out the year
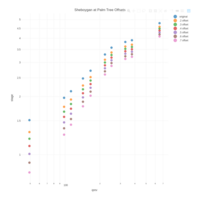
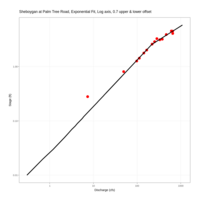
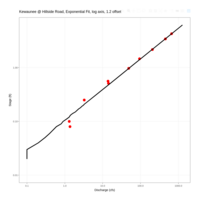
Sheboygan Palm Tree; 2019, log, 0.6 offset
lower exponent = 1.25
upper exponent = 2.61
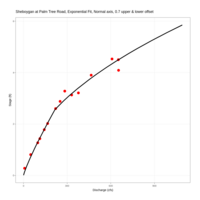
Sheboygan Palm Tree; 2019, normal, 0.6 offset
lower exponent = 1.25
upper exponent = 2.61
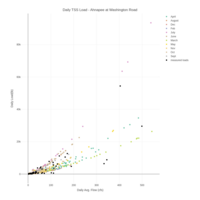
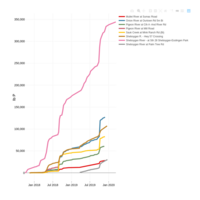
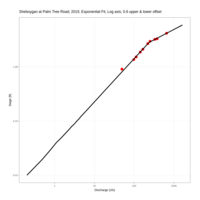
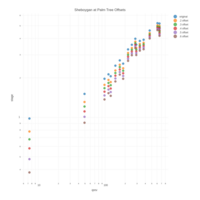
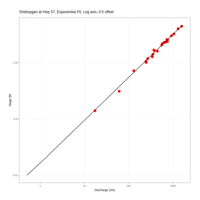
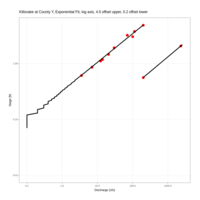
Sheboygan at Palm Tree Road, log, 0.7 offset
Lower exponent = 1.17
Upper exponent = 1.96
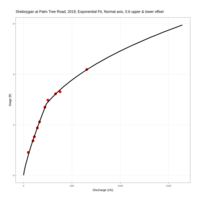
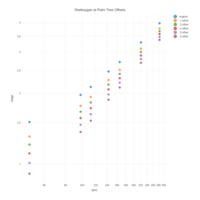
Sheboygan at Palm Tree Road, normal, 0.7 offset
Lower exponent = 1.17
Upper exponent = 1.96
Sheboygan Palm Tree - offsets
use 0.6
Sheboygan at Palm Tree offsets
use 0.6
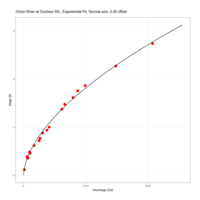
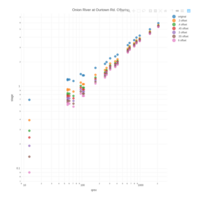
Onion River at Ourtown Road, Normal Axis, 0.45 offset
Exponent = 1.73
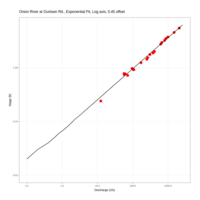
Onion River at Ourtown Rd., Log Axis, 0.45 offset
Exponent = 1.73
Onion offsets
Use 0.45
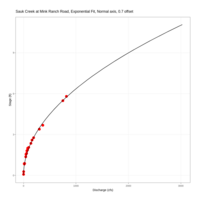
Sauk Creek at Mink Ranch Road, Normal, 0.7 offset
Exponent = 2.00
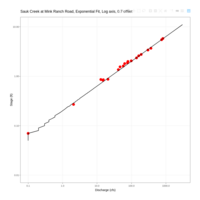
Sauk at Mink Ranch Road, log, 0.7 offset
exponent = 2.00
Sauk offsets
try 0.7 offset
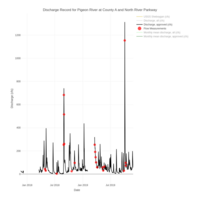
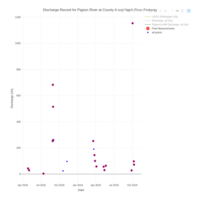
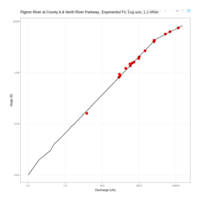
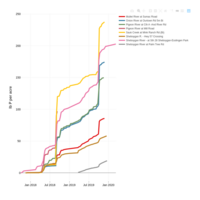
Pigeon River at Cty A & River Pkwy, Log 1.2 offset
Lower exponent = 1.34
Upper exponent = 2.74

Pigeon River at Cty A & River Pkwy, Normal, 1.2 offset
Lower exponent = 1.34
Upper exponent = 2.74
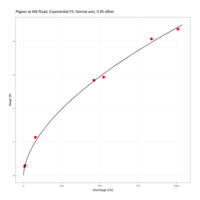
Pigeon at Mill, Normal Axis, 0.95 offset
Exponent = 1.74
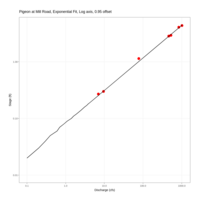
Pigeon at Mill Rd, log axis, 0.95 offset
Exponent = 1.74
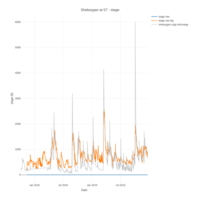
Pigeon at Mill offsets
try 0.95
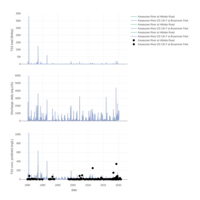
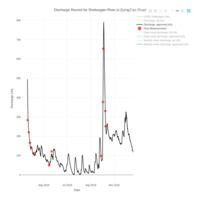
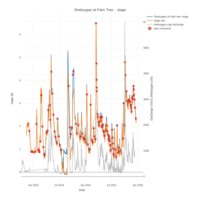
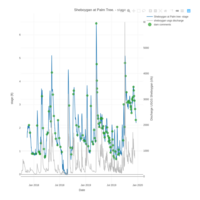
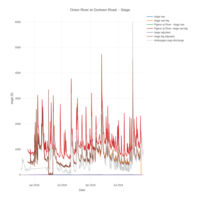
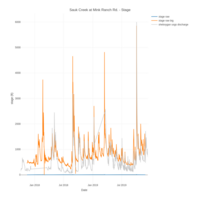
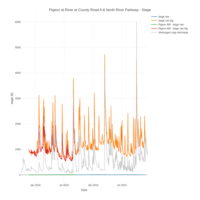
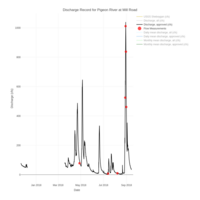
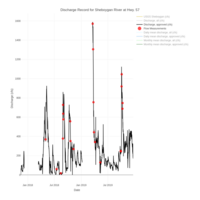
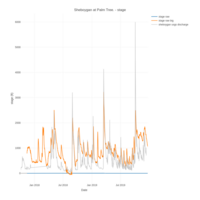
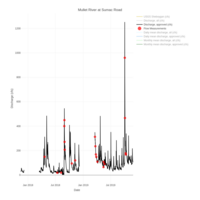
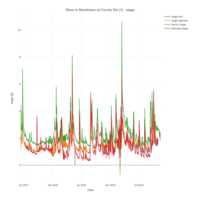
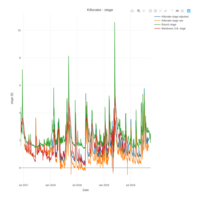
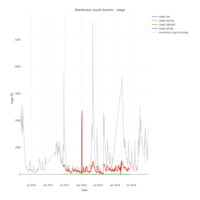
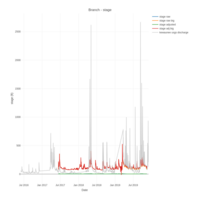
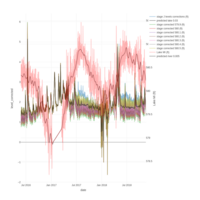
Pigeon at Mill - stage
Oscillations may be due to Howards Grove WWTP and/or Lk Mi backwater.
Shebogyan at 57, Log axis, 0.5 offset
Exponent = 1.31
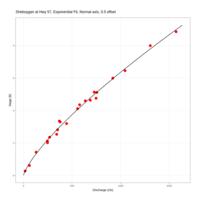
Sheboygan at 57, normal axis, 0.5 offset
Exponent = 1.31
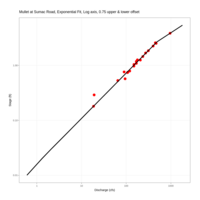
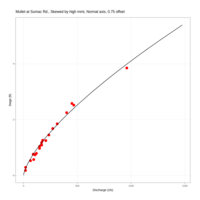
Mullet, Log axis, 0.75 offset
Lower exponent = 1.21
Upper exponent = 1.88
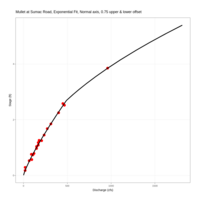
Mullet, normal axis, 0.75 offset
Lower exponent = 1.21
Upper exponent = 1.88
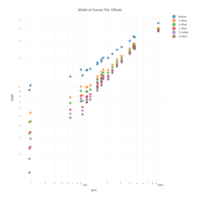
Mullet at Sumac Offsets
try 0.7
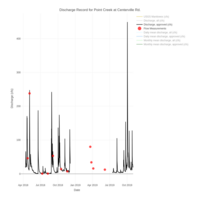
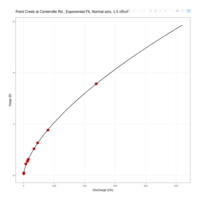
Point Creek at Centerville Rd., Normal axis, 1.5 offset
Exponent = 1.57
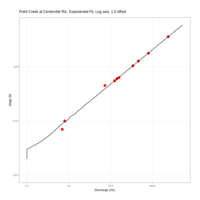
Point Creek at Centerville Rd, log axis, 1.5 offset
Exponent = 1.57
Point at centerville rd. Offsets
1.5 chosen
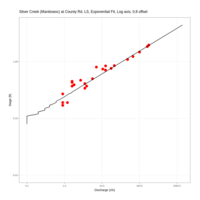
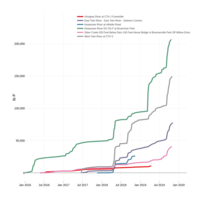
Silver Creek (Manitowoc) at County Rd. LS, Log axis, 0.8 offset
Exponent = 2.49
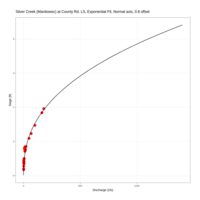
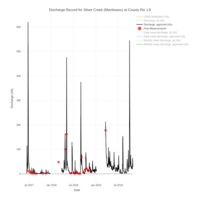
Silver Creek (Manitowoc) at County Rd. LS
2017 data may be over predicted due inaccurate stage from change in downstream control. High flows may be over or under predicted.
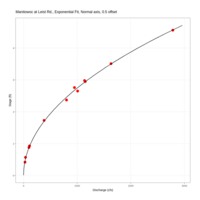
Manitowoc at Leist, normal axis. 0.5 offset
Exponent = 2.01
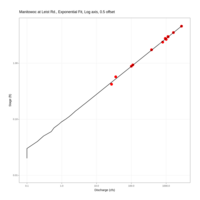
Manitowoc at Leist, log axis, 0.5 offset
Exponent = 2.01
Manitowoc offsets
try 0.4

Killsnake rating, normal axis, 0.2 lower, 4.5 upper offsets
lower exponent= 1.95
upper exponent = 1.89
Killsnake rating, log axis, 0.2 lower, 4.5 upper offsets
lower exponent= 1.95
upper exponent = 1.89
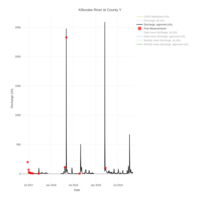
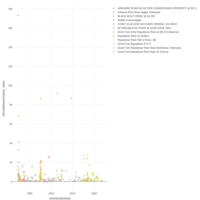
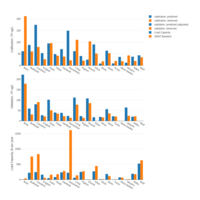
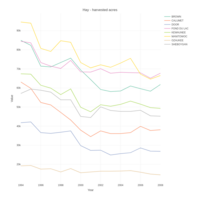
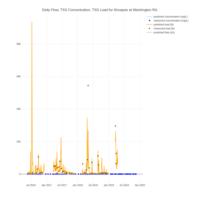
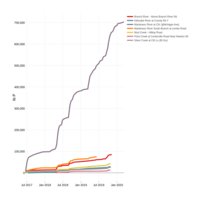
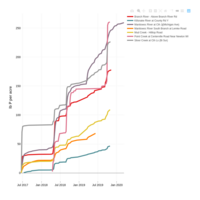
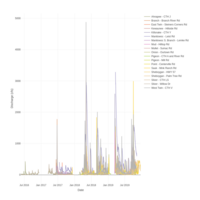
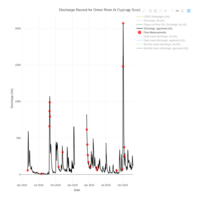
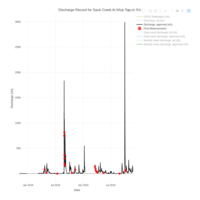
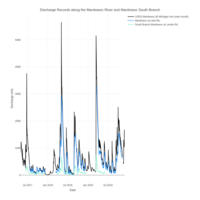
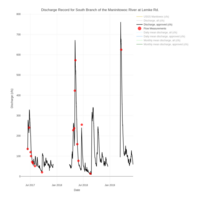
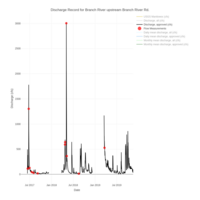
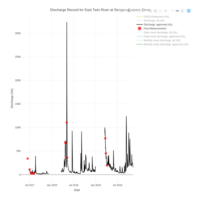
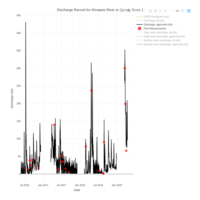
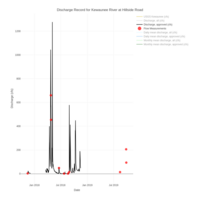
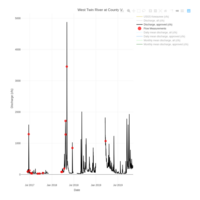
Daily Discharge of Killsnake and other Manitowoc Basin Sites
Watershed area at gaging locations:
Manitowoc South Branch - 109 sq mi
Branch - 108 sq mi
Mud - 39 sq mi
Killsnake at Y - 32 sq mi
Killsnake offsets
0.2 for lower, 4.5 for upper
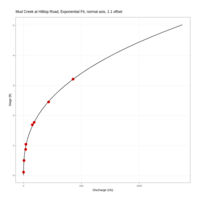
Mud Creek, normal axis, 1.1 offset
exponent = 2.60
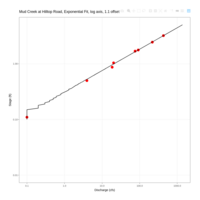
Mud Creek, log axis, 1.1 offset
exponent = 2.60
Mud offsets
Using 1.1
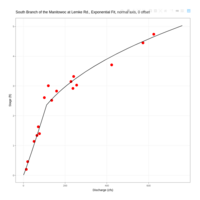
Manitowoc South Branch, normal axis
lower exponent = 0.94
upper exponent = 2.55
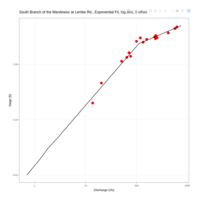
South Branch Manitowoc, log axis
lower exponent = 0.94
upper exponent = 2.55
Branch River, log axis, 1.0 offset
lower exponent = 1.93
upper exponent = 3.54
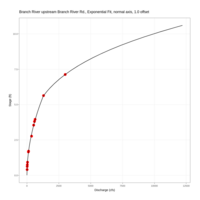
Branch River, normal axis, 1.0 offset
lower exponent = 1.93
upper exponent = 3.54
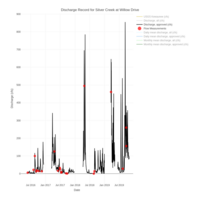
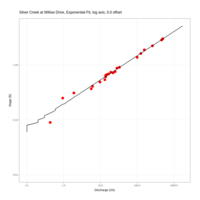
Silver Creek at Willow Drive, log axis, 0 offset
exponent = 2.27
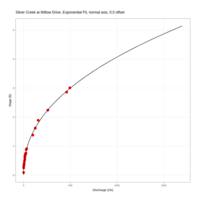
Silver Creek at Willow Drive, normal axis, 0 offset
exponent = 2.27
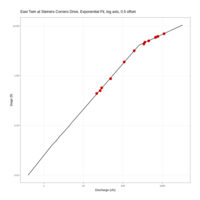
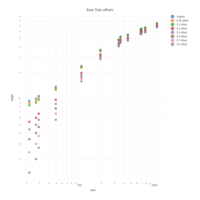
East Twin at Steiners Corners, log axis, 0.5 offset
Lower Exponent = 1.09 Upper Exponent = 2.71
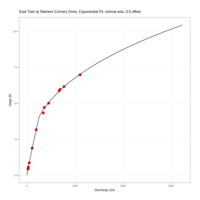
East Twin at Steiners Corners, normal axis, 0.5 offset
Lower Exponent = 1.09
Upper Exponent = 2.71
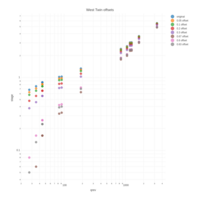
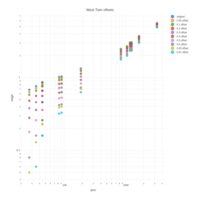
West Twin, log axis, 0.63 upper, 0.3 lower
lower exponent = 1.25
upper exponent = 1.37
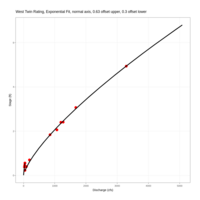
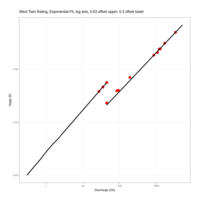
West Twin, normal axis, 0.63 upper, 0.3 lower
lower exponent = 1.25
upper exponent = 1.37
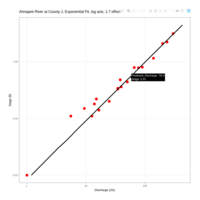
Ahnapee River at County J, log axis
Exponent = 0.97
Ahnapee River at County J, normal axis
exponent = 0.97
Ahnapee Offsets
1.7 chosen
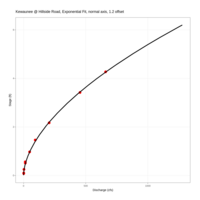
Kewaunee at Hillside, normal axis, 1.2 offset
exponent = 1.76
Kewaunee at Hillside Road, log axis, 1.2 offset
exponent = 1.76
Ahnapee backwater elevation decision
smoother currently for 580.3