MastaG
M.G.
Recently Published
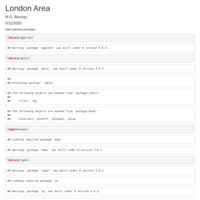
London Area
A basic map of London to begin data visualization.
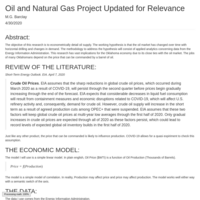

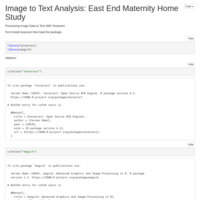
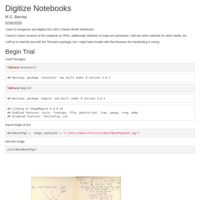
Image to Data: East End Maternity Home Study
Using the Tesseract, and Magick packages I was able to create a data frame from a table on paper.
The data presented represents the cohort of 10 + Years Married.
Including variables:
OBS:
#UNKNOWN#
BABYR:
EEMH delivery year.
MOMAGE:
Mother's age
WEDYR:
#UNKNOWN#
WBYRS:
Years married at birth.
MOWEDAGE:
Mother's age at wedding.
NOPREG:
Number of pregnancies.
HISTPREG:
Pregnancies per year.
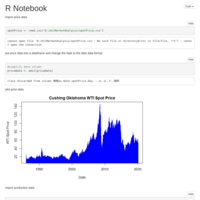
Notebook for London Trip
I am making some quick data and econometric tools to use on a research trip to London.Should be updated with more capabilities as soon as I can get them working.
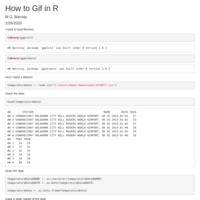
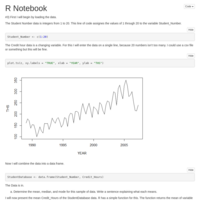
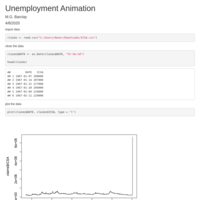
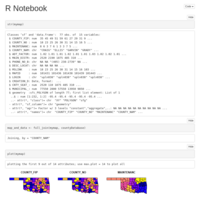
Learning Animation
Temperature data from Will Rogers World Airport 2015 - 2019.
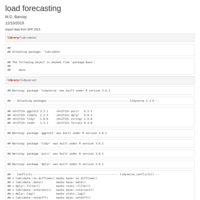
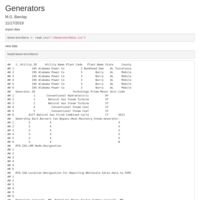
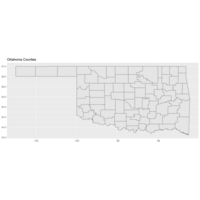
OK Energy
sorting data for Oklahoma electric generation
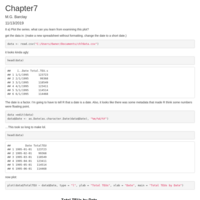
Plot
fixed