
Jing_335
JingC
Recently Published
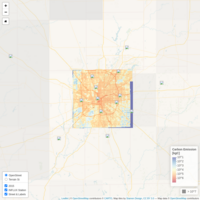
Indianapolis total annual CO2 emission interactive map V.2 [Leaflet]
Update:
-Kept 2015 emission layer only since all the years have approximately same data.
-Added measurement sites from the Indianapolis Flux Experiment (INFLUX)
https://sites.psu.edu/influx/site-information/
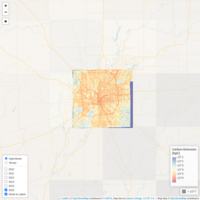
Indianapolis total annual CO2 emission interactive map [Leaflet]
An interactive map showing the total CO2 emission in Indianapolis.
The emission is plotted as a heat map. Data ranged from 2010 to 2015.
Emission data source -- Hestia Project:
http://hestia.rc.nau.edu/index.html
Created: Jing Chen
6/25/2020
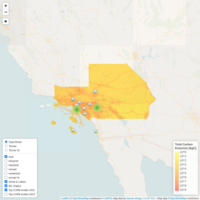
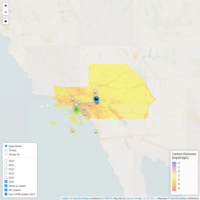
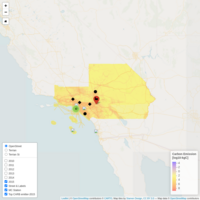
LA Basin 2011 sectored CO2 emission interactive map V.5 [Leaflet]
Update on coloring and legend of the annual map, remove purple color at the lower end, and cap minimum to 10^0.
Correct sector legend title.
Added CARB 2011 top emitter sites.
6/17/2020
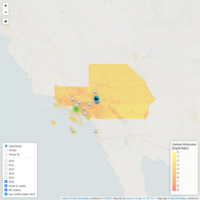
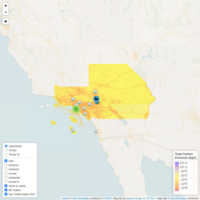
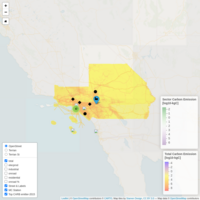
LA Basin total annual CO2 emission interactive map V.3 [Leaflet]
Update on coloring and legend of the annual map, remove purple color at the lower end, and cap minimum to 10^0.
6/17/2020
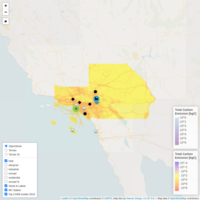
LA Basin total annual CO2 emission interactive map V.2 [Leaflet]
Final version for the 2010 to 2015 annual total map at this benchmark period.
6/12/2020
LA Basin 2011 sectored CO2 emission interactive map V.4 [Leaflet]
Final version for the 2011 sectored map at this benchmark period.
6/12/2020
LA Basin 2011 sectored CO2 emission interactive map V.3 [Leaflet]
Update coloring of onroad% map w/ diverging color.
6/4/2020
LA Basin 2011 sectored CO2 emission interactive map V.2 [Leaflet]
Update lower limit of sector.
6/3/2020
LA Basin 2011 sectored CO2 emission interactive map [Leaflet]
An interactive map of 2011 CO2 emission by sectors on top of total emission in the LA basin area. Values are given as the annual total emission.
Included sectors: Residential, Industrial, Electricity Production ("elecprod"), and Onroad.
A percentage of the onroad/total is included to show the percentage of traffic emission.
A series of GHG monitoring site (MC Station) runs under the Megacities Project is included.
Also included are the top carbon emitters identified in the CARB Pollution Mapping Tool. They only cover the "Electricity generation" and "Refinery" sector. The included data are of 2015.
Emission data source: The Hestia Project
Project home page: http://hestia.rc.nau.edu/index.html
NIST repository: https://data.nist.gov/od/id/677A0E21B4C4694EE05324570681AACE1898
Megacities Project homepage: https://megacities.jpl.nasa.gov/portal/
CARB Pollution Mapping Tool: https://ww3.arb.ca.gov/ei/tools/pollution_map/
Author: Jing Chen
6/3/2020
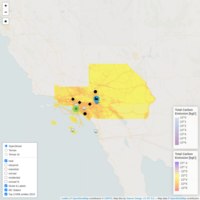
LA Basin total annual CO2 emission interactive map [Leaflet]
An interactive map showing the total CO2 emission in the LA basin area. The emission is plotted as a heat map. The data is ranged from 2010 to 2015.
A series of GHG monitoring site (MC Station) runs under the Megacities Project is included.
Also included are the top carbon emitters identified in the CARB Pollution Mapping Tool. They only covers the "Electricity generation" and "Refinery" sector. The included data are of 2015.
Emission data source: The Hestia Project
Project home page: http://hestia.rc.nau.edu/index.html
NIST repository: https://data.nist.gov/od/id/677A0E21B4C4694EE05324570681AACE1898
Megacities Project homepage: https://megacities.jpl.nasa.gov/portal/
CARB Pollution Mapping Tool: https://ww3.arb.ca.gov/ei/tools/pollution_map/
Author: Jing Chen
5/30/2020