Heseraj
Mosa Rahimi
Recently Published

plotting a logistic regression using ggplot
note:
glm function gives nonsensical probabilities, a.ka. negatives, because of the response type in the predict function

wage based on age polynomail degree 4
using ggplot creating the graph for wage based on poly(age, 4)

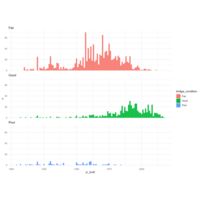
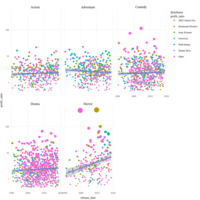
Horror Movie Distributors and their production budget
Top 15 horror movie distributors based on the median of their production budget.

Top 25 Major Inome color coded by major category
Based on Tidy Tuesday dataset from October 2018

Log Hourly bikers in DC
The graph of log of number of bikers in Washington DC

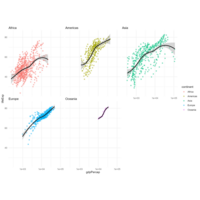
LDA for Iris data
using ggpairs for a LDA of Iris dataset

Plot
The graph of the probability of default using ggplot

HTML
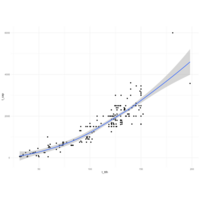
Creating sales hyperplane using TV and Radio Advertising

Plot
Creating a pairwise plot for credit card sales


Reconnecting with DS
start of reconnecting with DS
Plot
just working with some data
Plot
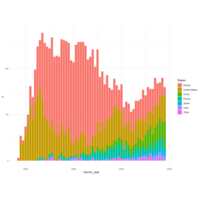
Space Launches
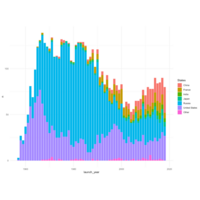
Plot
Space launches
Plot
Captures and status of Dolphins
Plot
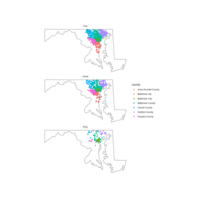
Bridge condition vs distribution across country
Plot
Bridge Conditions, year built
Plot
Turbine size and capacity
Plot
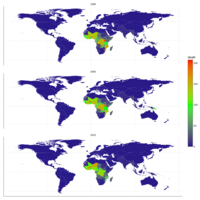
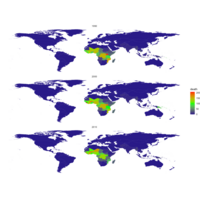
Malaria death per decades
HTML
plotly Malaira

Plot
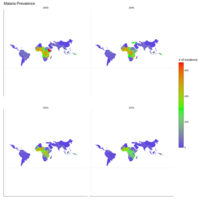
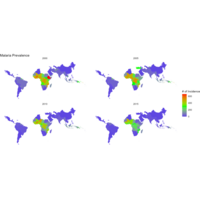
Malaria
Plot
Malaria Incidence

HTML
Just having fun.
HTML
This is one type of my work. I am looking to expand on it.

Shinyapp
New work that I am learning.

Document
This is my new work.

Document
This is my first time publishing a file in Rpubs.