
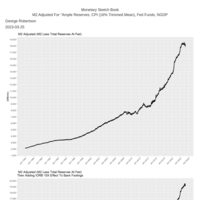
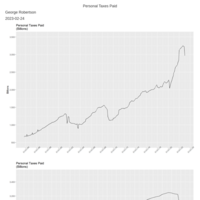
GMR_NYC
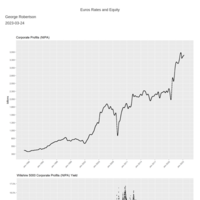
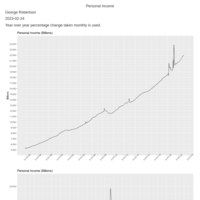
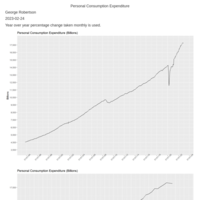
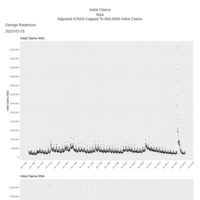
George Robertson
Recently Published


Impulse
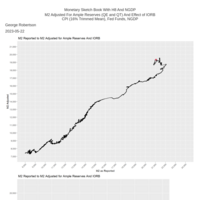
Update Impulses - Fiscal, Monetary, and Trade.
Feb 6 2026


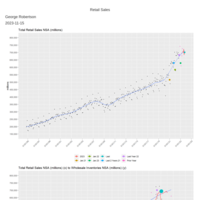


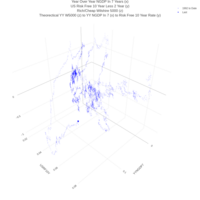
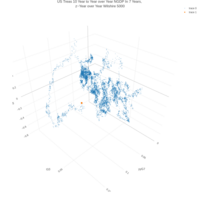


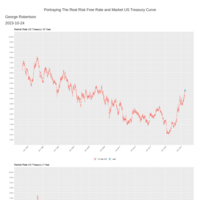


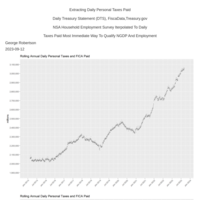


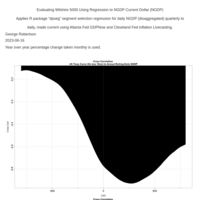

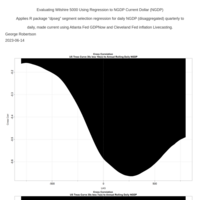


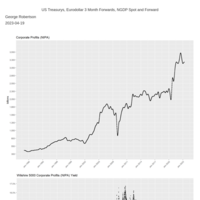


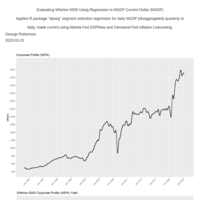


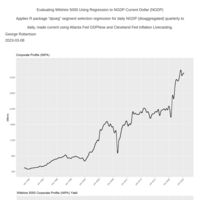

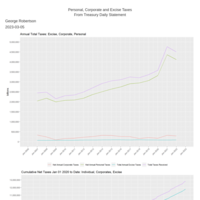


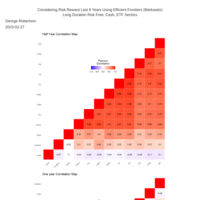


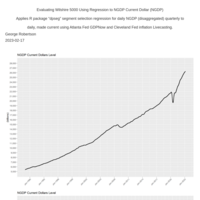


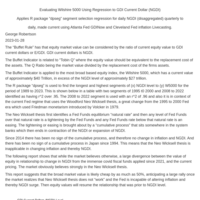


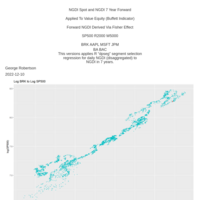
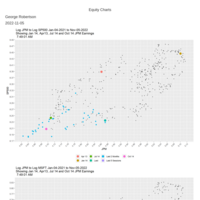
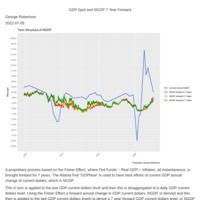
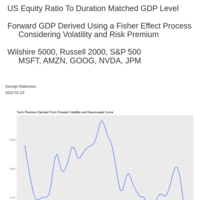
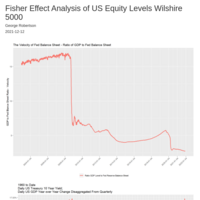
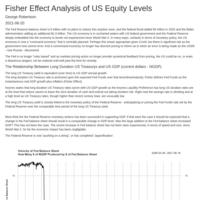
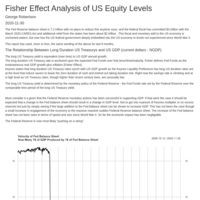
Fisherian Analysis Between US Treasurys, Equity, and Forward GDP 1 6 2023
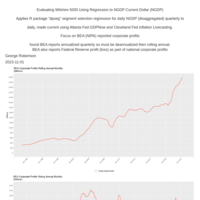
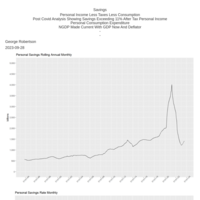
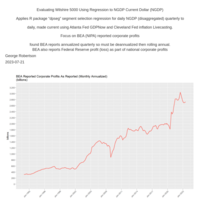
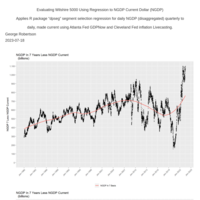
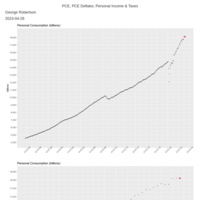
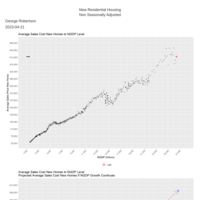
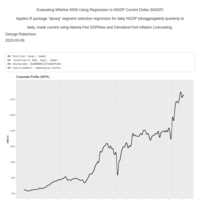
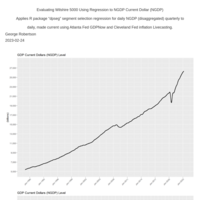
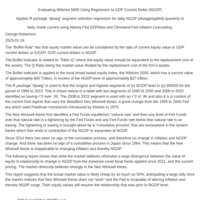
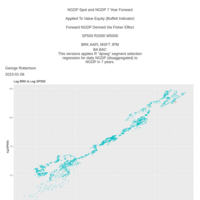
A simple model to identify how in our out of synch equity prices are using a forward Fisher Effect nominal GDP level, and a "spot" nominal GDP level.
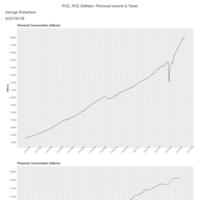
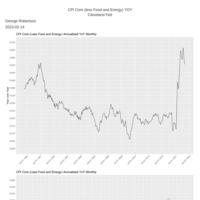
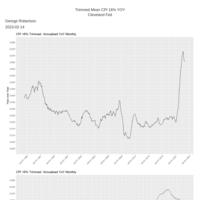
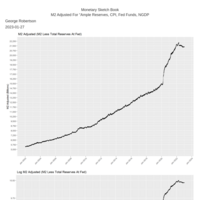
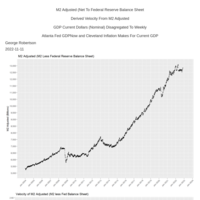
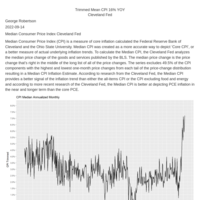
The latest BEA current dollar GDP level is used then brought forward to spot by disaggregating the quarterly data to daily and then applying Atlanta Fed GDPNow along with Cleveland Fed inflation livecasting rate (PCE) to derive the growth to spot.
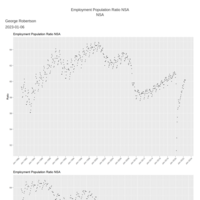
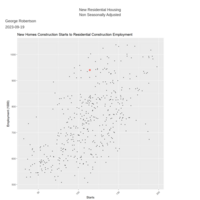
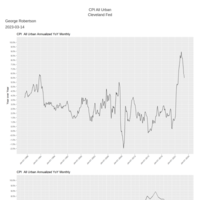
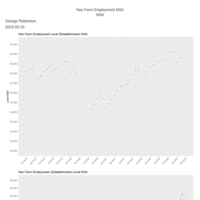
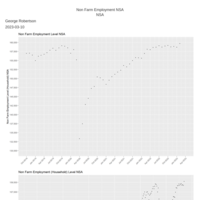
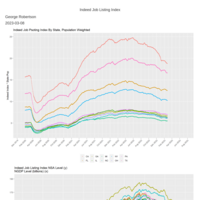
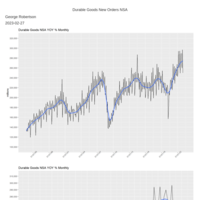
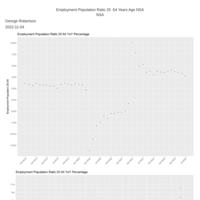
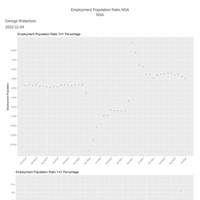
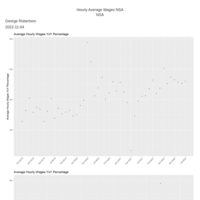
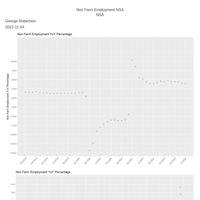
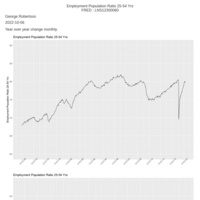
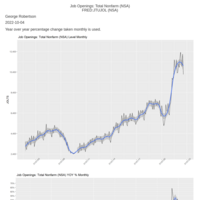
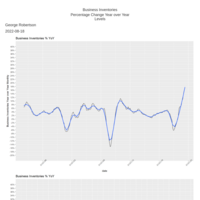
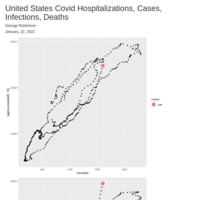
Employment Population Ratio (NSA) 1/6/2023
A good read is Hotchkiss (2014)
https://www.atlantafed.org/-/media/documents/research/publications/wp/2014/wp1408.pdf


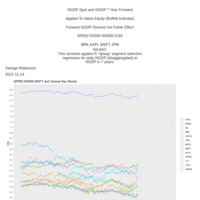


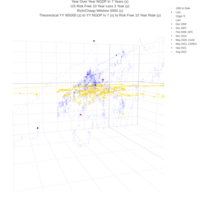
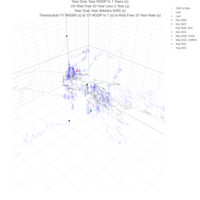
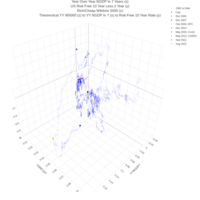
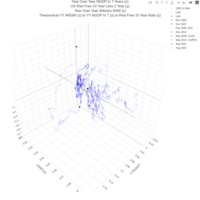
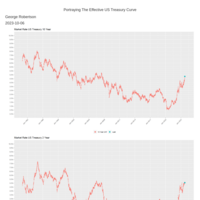
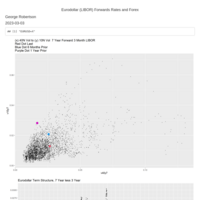
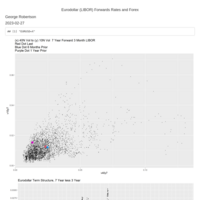
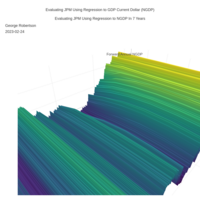
Fisherian Analysis Between US Treasurys, Equity, and Forward GDP
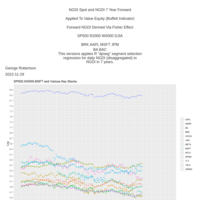
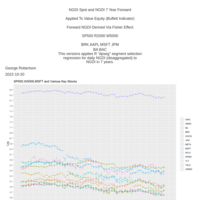
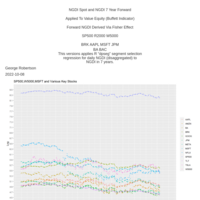
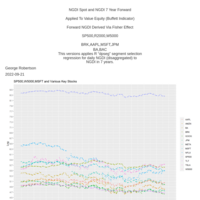
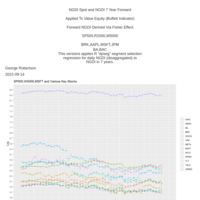
Using best regression segment for equity to NGDP daily (derived from disaggregated quarterly to daily and the Atlanta Fed GDP Now.
The slope and intercept for this regression is applied to equity to NGDP in 7 years which uses a Fisher Effect brought forward.


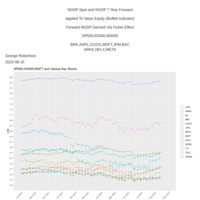
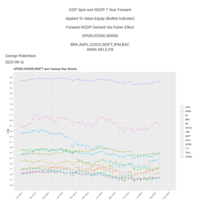


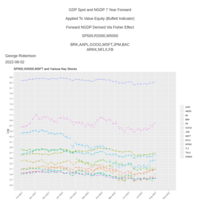


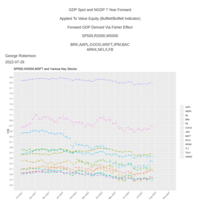


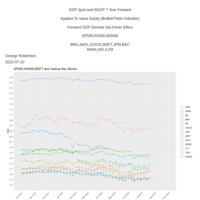

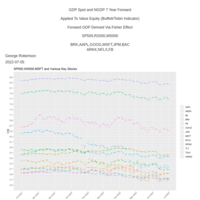


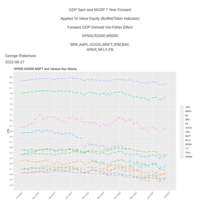


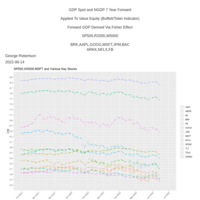


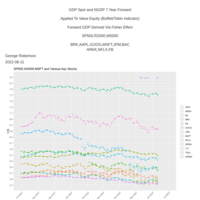


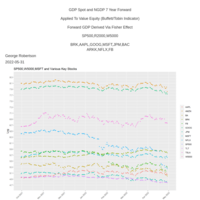


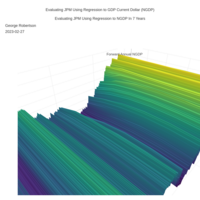
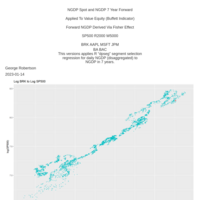
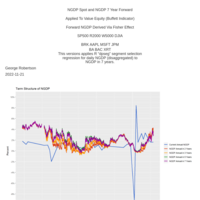
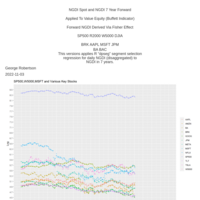
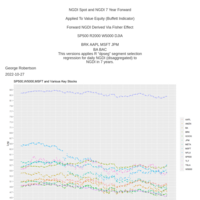
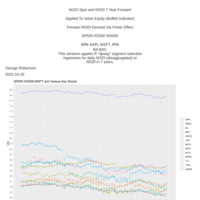
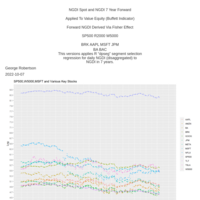
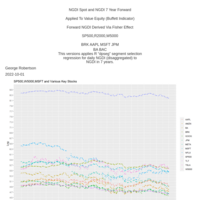
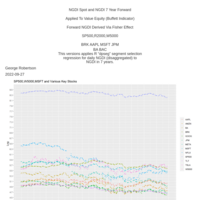
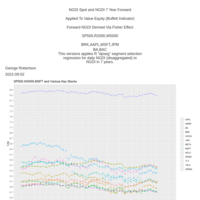
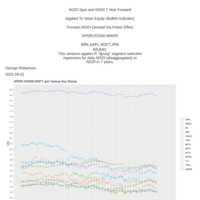
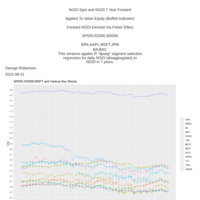
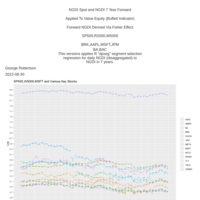
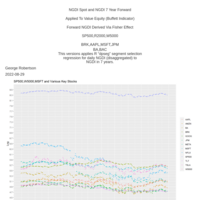
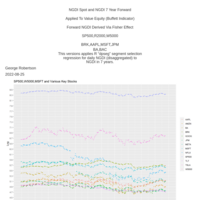
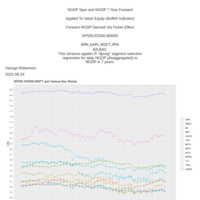
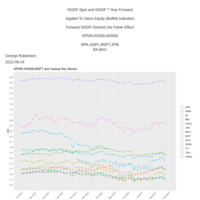
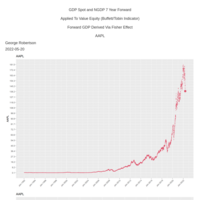
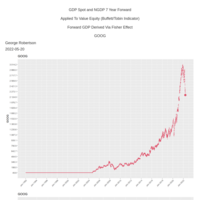
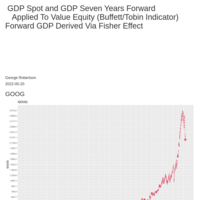
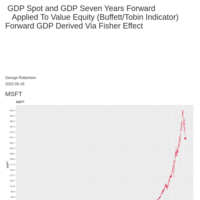
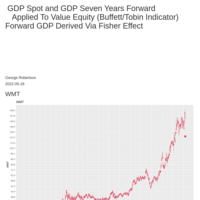
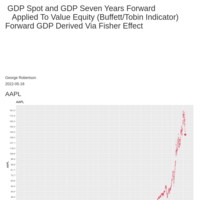
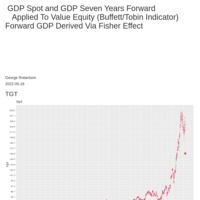
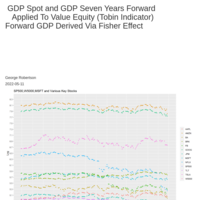
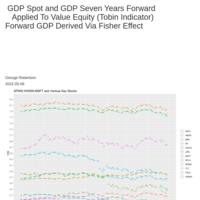
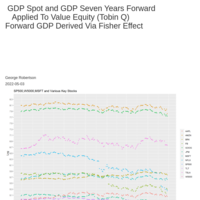
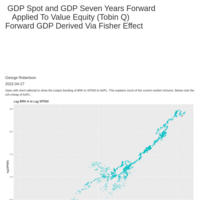
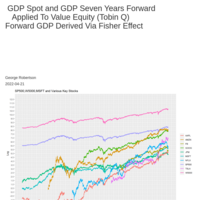
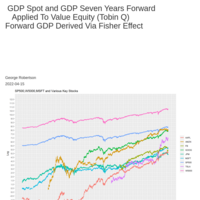
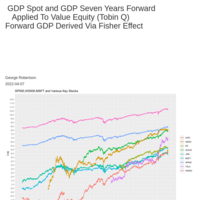
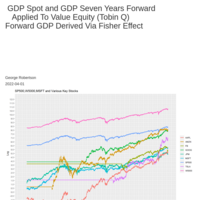
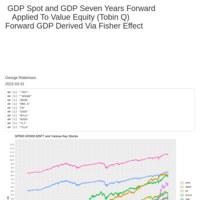
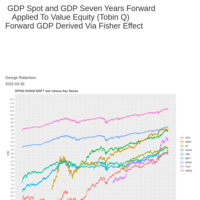
GDP Spot and NGDP 7 Year Forward Applied To Value Equity (Buffett/Tobin Indicator) Forward GDP Derived Via Fisher Effect
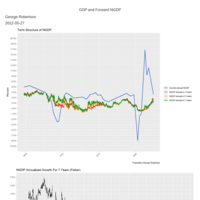
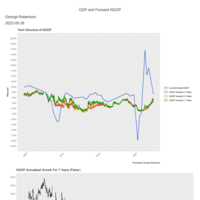
GDP Spot and NGDP 7 Year Forward
Applied To Value Equity (Buffett/Tobin Indicator)
Forward GDP Derived Via Fisher Effect
SP500,R2000,W5000
BRK,AAPL,GOOG,MSFT,JPM,BAC
ARKK,NFLX,FB


Fisher Effect Analysis of US Equity
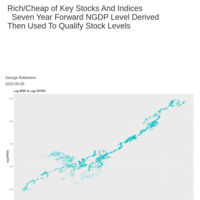
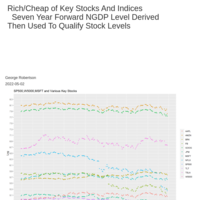
1) To get somewhat equivalent duration, derive a 7 year forward NGDP level.
2) Take equity and compare to the forward NGDP in a Tobin like or "Buffett Indicator".
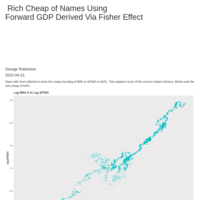
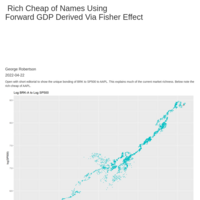
3) Derive rich/cheap.

Macro Rich Cheap (Buffett Indicator)
GDP modified to NGDP level 7 years forward so closer duration match equity.


Fisher Effect Analysis of US Equity
There is a significant surge in 7 years forward NGDP level. The forward is now at $30 trillion.


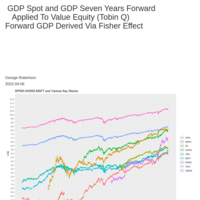

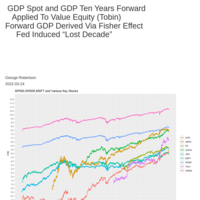
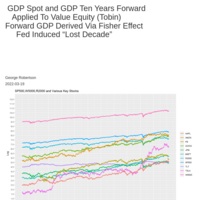


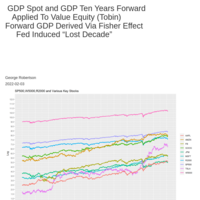


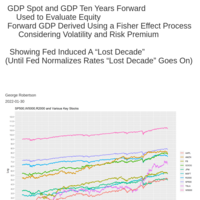
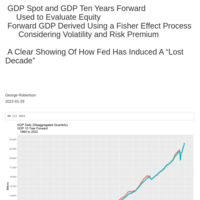
GDP and GDP 10 Years Forward
Shows that the Fed has induced a "Lost Decade" and until rates normalized, another "Lost Decade" will result.
While overvaluation in R2000 and stocks like AMZN have reduced towards fair value, still 10% to 20% more to go.
Most equity still 30% to 50% overvalued.


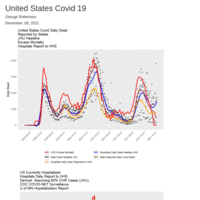
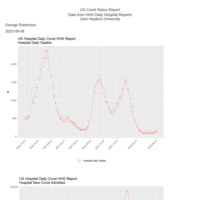
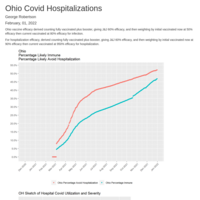
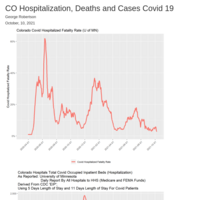
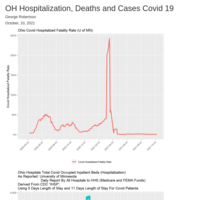
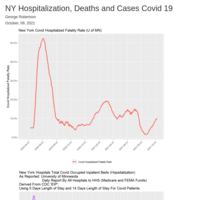
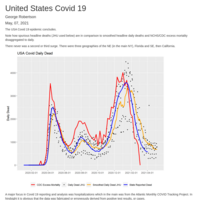
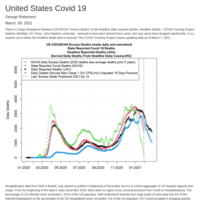
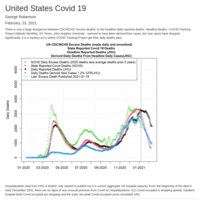
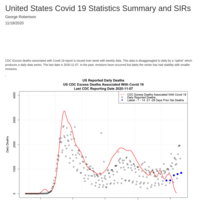
US Covid 19 metrics: SIR models - Severity Ratios
Data source:
U of MN Hospitalizations (Continuing The COVID Tracking Project)
John Hopkins University Daily Cases and Deaths
CDC COVID-NET Hospitalizations
NCHS Excess Mortality and State Covid Deaths


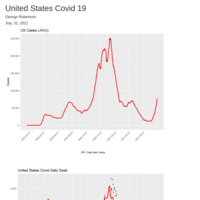
US Covid 19
Useful slides.
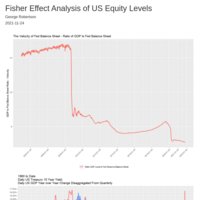

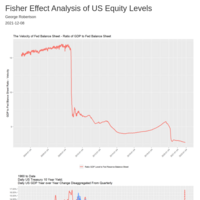
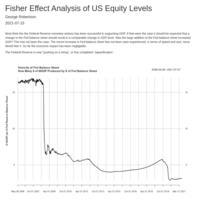
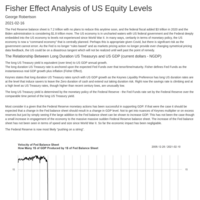
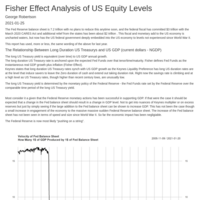
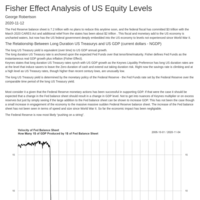
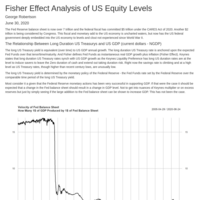
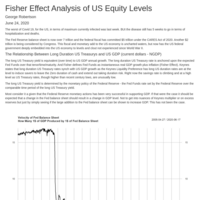
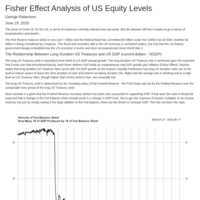
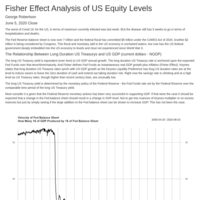
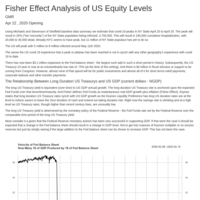
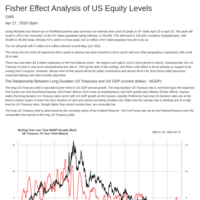
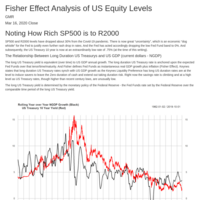
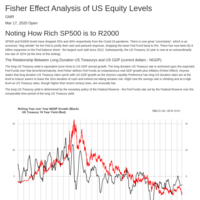
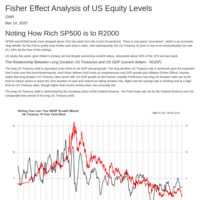
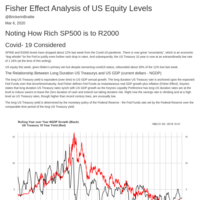
Fisher Effect Analysis of US Equity Levels
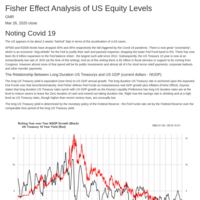
If Fisher/Tobin identified the relationship of long term Federal Reserve policy to US GDP and in turn US GDP to US risky assets levels, in particular the SP500, then SP500 are set to drop 50%. Since this is contrary to general perception when it comes about - as it has for centuries - it will be shock and likely at first trade even lower.


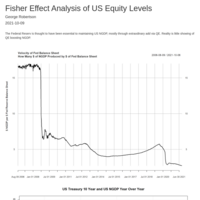


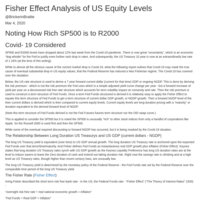
Fisherian Analysis Between US Treasurys, Equity, and Forward GDP
Using a forward Tobin Q - SP500 to 7 year forward NGDP level - SP500 indicates support is around 2100, or 100% overvalued.
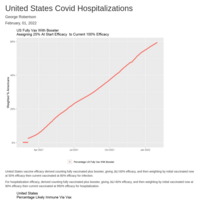
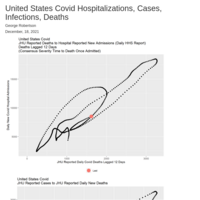
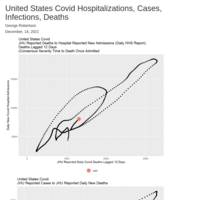
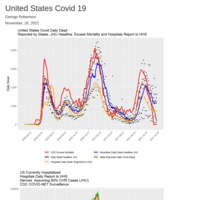
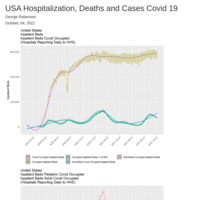
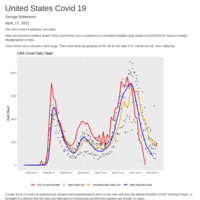
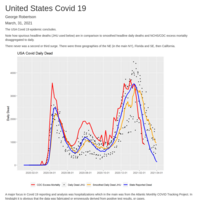
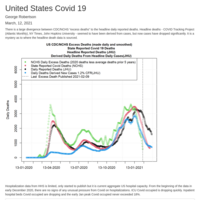
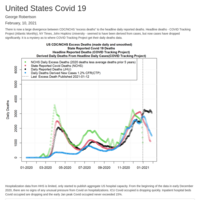
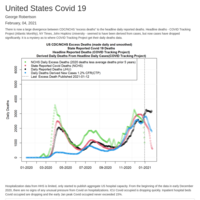
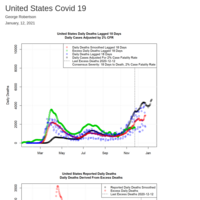
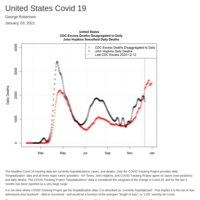
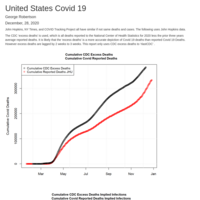
United States Covid 19
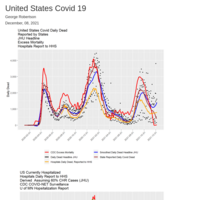
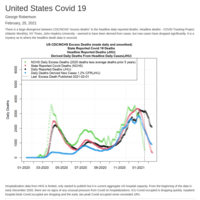
While deaths could "catch up", there is no indication of a Delta Variance surge in excess mortality and state reported deaths. There is a surge in headline deaths from John Hopkins and hospitalizations from headline Covid Act Now, but this is suspect as track case data with non consensus severity.
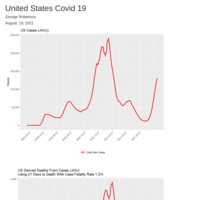
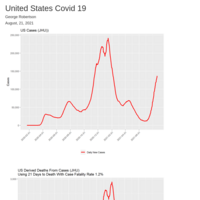
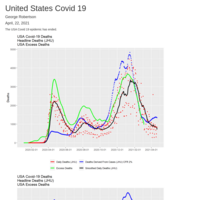
USA Covid Review
There does not appear to be a large surge from Delta Variant. The data headlined for daily deaths and hospitalizations is suspect and seems derived/invented from case data. Daily case data does not have statistical significance.
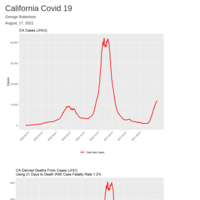
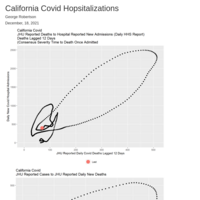
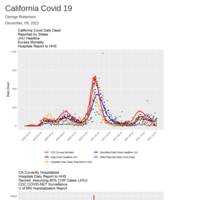
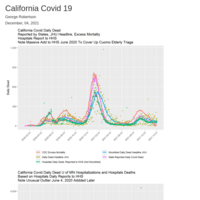
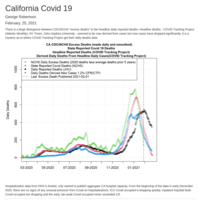
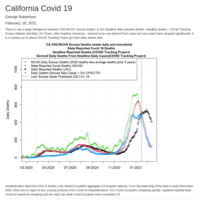
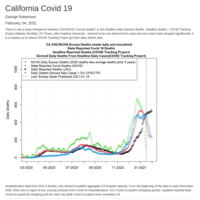
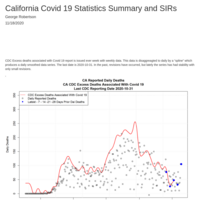
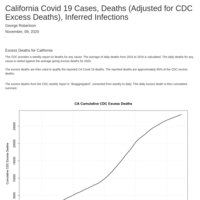
CA Covid 19 Cases Deaths Infections
The reported Delta surge in CA is not being confirmed by death data. LIkely the "surge' is invented using case data.

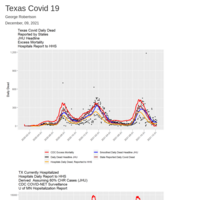
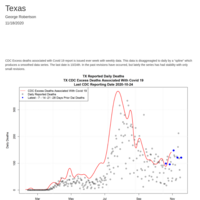
TX Covid Surge Seems Spurious
It seems the current Dellta variant surge of Covid is a media invented event.
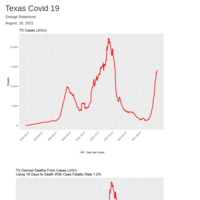
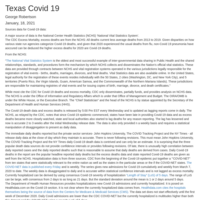
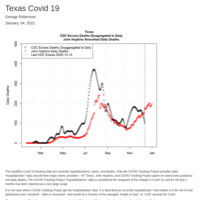
Texas Covid
Texas headline data on hospitalization and daily death data seems derived not actual from cases. Texas does not report hospitalization to NCHS/CDC. Death data that has been reliable to date has been excess mortality and state reported deaths. Neither series indicate a surge in Covid. The Covid surge reported seems near fabricated.

Fisher Effect Analysis of US Equity Levels
Risk premium is plunging but higher rates are offsetting this to some degree. Yet 7 year forward NGDP growth has dropped by 30 basis points.
A forward Tobin Q has SP500 fair value at 2800, using a CAPM SP500 fair value is at 2100 or so.
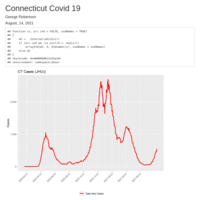
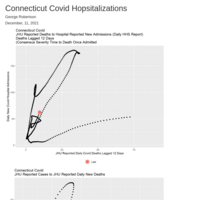
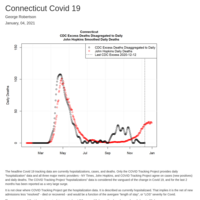
Connecticut Covid
Case surge is not being shown in deaths. Hospitalization data seems contrived, perhaps directly derived from case data.
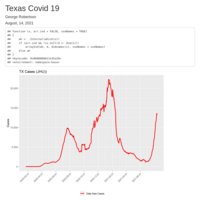
TX Covid Surge Seems Spurious
The reported Covid surge in Texas seems contrived. It is not being confirmed in excess mortality nor state reported deaths. Popular death data that media uses is suspect - JHU, UMN Project - as seems derived from case data, not actual. Same for hospitalization data.
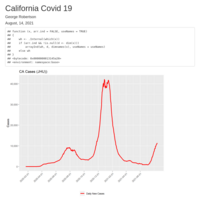
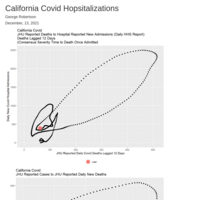
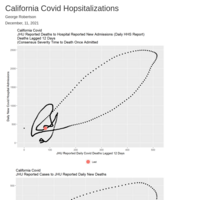
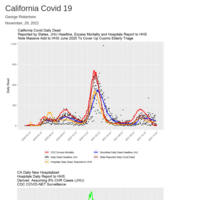
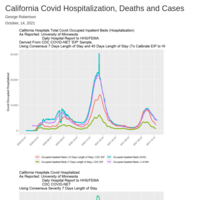
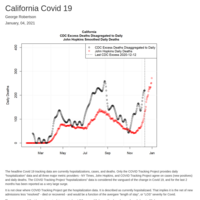
California Covid
The reported surge in Covid seems to be only in case data. Hospitalization data seems to be derived from case data and is not accurate.
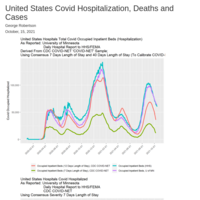
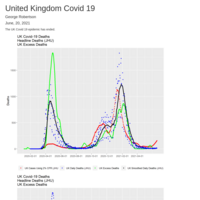
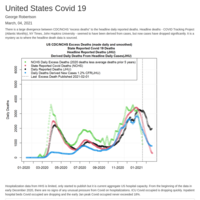
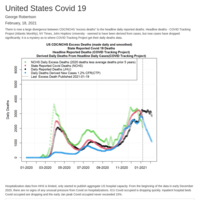
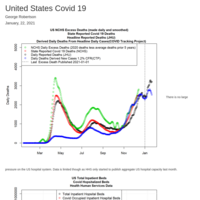
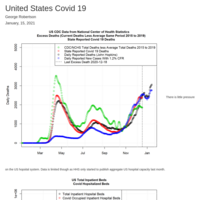
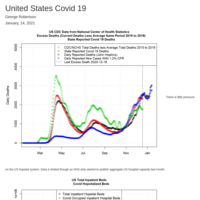
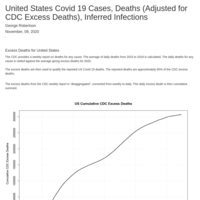
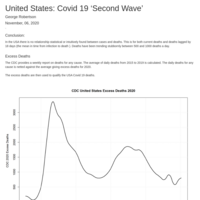
United States Covid 19
Current media and even CDC depicting a new wave in Covid based on cases. But deaths, and hospitalizations do not show another wave but indicate the epidemic is over.
Fisherian analysis of US equity value.
The forward GDP (NGDP) level has risen such that fair value for SP500 is now 2800, 40% below current level using a forward Tobin Q. The CAPM approach looking to growth of NGDP level for 7 years has SP500 fair value at 3300, down 25%.

Fisherian analysis of US equity values
Fisher has it that the spot risk free rate will equal the spot real GDP growth and the spot inflation rate. FF=i +GDP. This is the 'Fisher Effect' or the 'Fisher Rate' Various procedures are applied to construct a 7 year forward Fisher Rate and thereby a 7 year forward NGDP level is derived. This is similar duration to equity so a Tobin Q like ratio of equity levels to the Fisher forward NGDP level is derived over time.
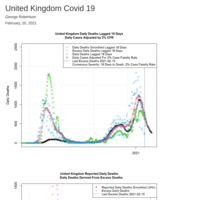
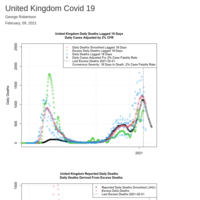
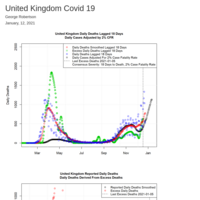
UK Covid
The UK Covid epidemic is over. The Delta Variant seems to be relatively benign and not a serious public health problem. The June 21st planned end of mitigation should continue.
Using Fisherian Analysis to Monitor Tobin Q Equity to GDP Over Time
While 7 year forward GDP level has improved off of lows of last year, SP500 and R2000 are still significantly overpriced using a Tobin Q like framing.
US Covid 19
It is over.
US Covid 19
The epidemic is over as total vaccinated and cumulative infected are well over 60% of the US populace.
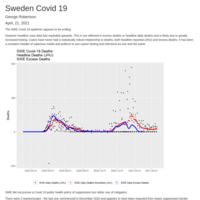
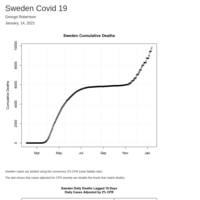
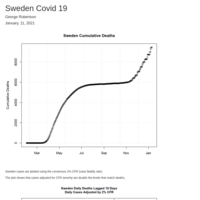
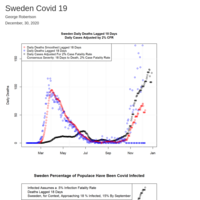
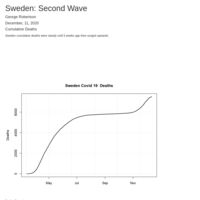
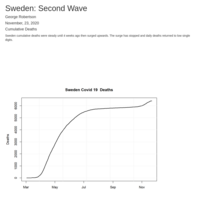
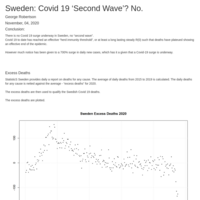
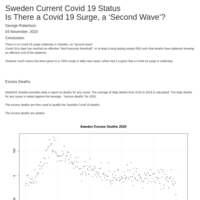
Sweden Covid 19
The epidemic in Sweden seems to be drawing to a close.
Politicos and a salacious press are constantly attacking Sweden and are now misusing, statistically, case data. The number of testing on Sweden has tripled since last year and doubled in the last few months.
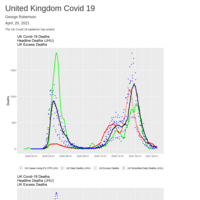
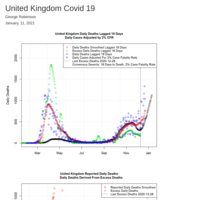
UK Covid 19
The UK Covid 19 epidemic has ended.
US Covid 19
US Covid 19 seems to be concluding. However there has been an increase of cases yet CDC COVID-NET hospitalizations have lately diverged and dropped.
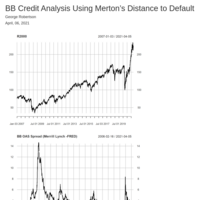
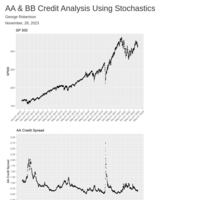
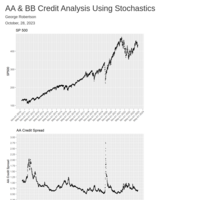
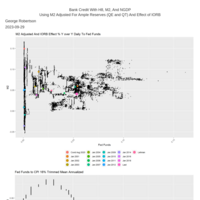
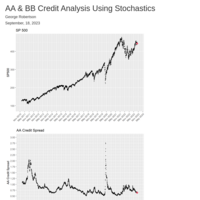
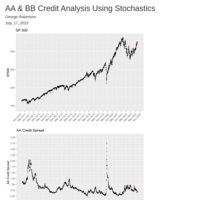
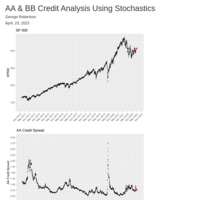
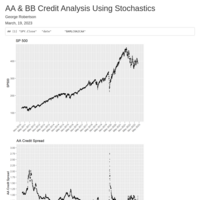
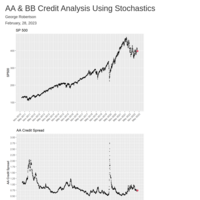
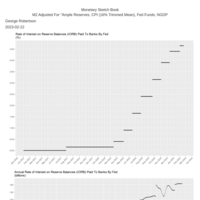
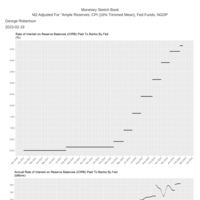
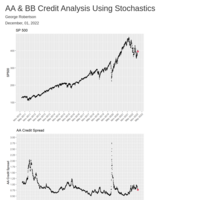
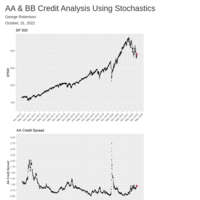
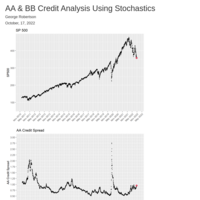
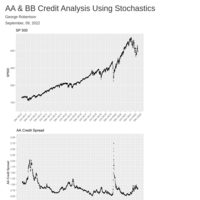
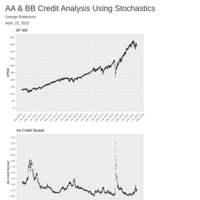
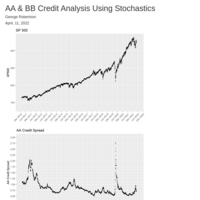
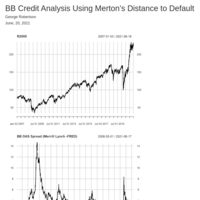
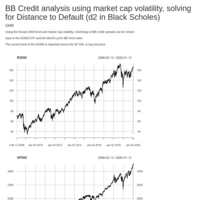
BB Credit Analysis
The degree that the Fed has destroyed price discovery for credit markets is not realized. This cannot end up well.
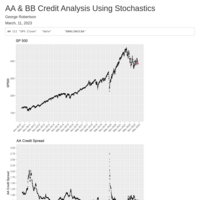
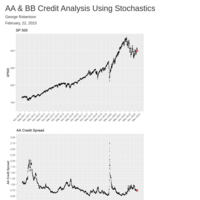
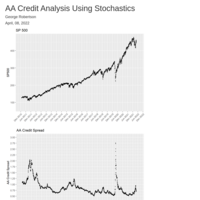
AA credit analysis using stochastics
It seems few realize how the Fed has eliminated price discovery from credit markets.
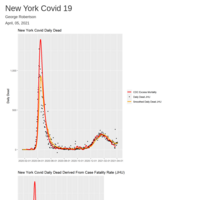
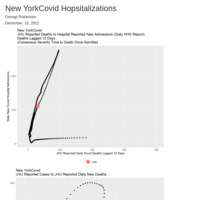
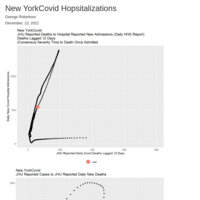
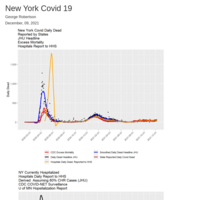
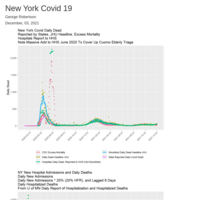
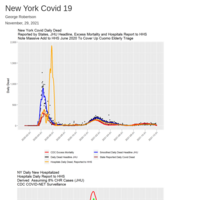
New York Covid
It seems the epidemic is over for NY State. A startling near 60% of the populace has had Covid 19.

US Covid 19
JHU and other headline services showing increase in cases but not reflected in CDC hospitalizations. Deaths indicate the epidemic is over.
US Covid 19
The epidemic is closing.
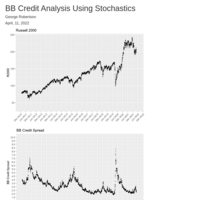
BB Credit Analysis
BB continues to trade at relative record tights and is poised to correct by 300 to 600 basis points widening.
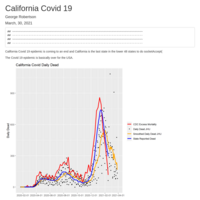
California Covid
The epidemic is ending for CA and has basically ended for the USA
US Covid
It is over....

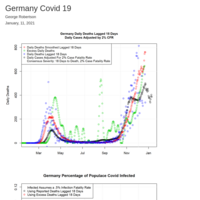
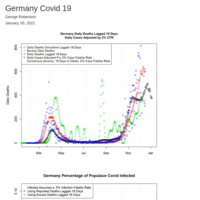
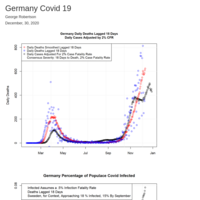
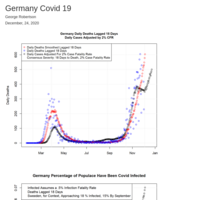
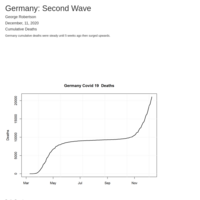
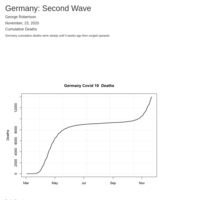
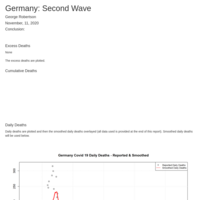
Germany Covid 19
If Sweden is preceding Germany, and if Germany does not double pace of vaccination, Germany will experience a doubling of infections and deaths over next 3 months.

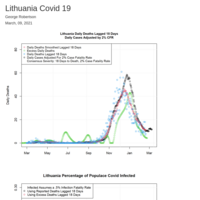
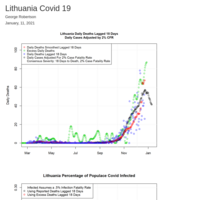
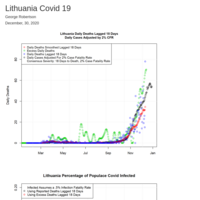
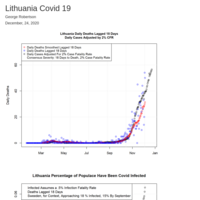
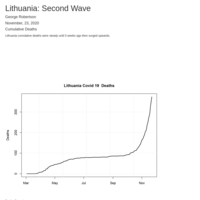
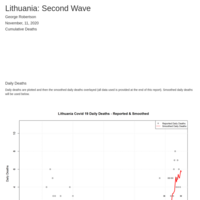
Lithuania Covid
While the "integral" still seems low, using Sweden as base case, Covid 19 looks like it may be coming to an end in Lithuania.
Being at cross roads to Western Europe (Sweden etc) and Eastern Europe (Poland) and then on to Russia, Lithuania is a good indicator for EU in general.
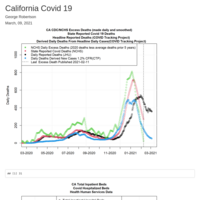
California Covid
The Covid 19 epidemic is near over for California.
California is last lower 48 geography to resolve Covid so when Covid epidemic ends for California it will be over for the US.
California is the "fat they singing" that ends the opera.
US Covid 19
1) The epidemic is over but for a some pockets;
2) CA was the last major locale;
3) Never surges, just the epidemic unrolled across the vast US and deaths were a function of population;
4) The COVID Tracking Project data was biased if not contrived, especially hospitalizations.
US Covid 19
It is over....


Fisher Effect Analysis of US Equity Levels
5 to 7 year forward US GDP has increased about 75 basis points from recent lows, but there is still no growth for next 7 years. SP500 using a Tobin Q of the forward has SP500 fair value at 2200 and using CAPM at 1800.

California Covid
It is likely over.
US Covid
Deaths are plunging. Headline deaths are still lagging excess deaths and state reported deaths. Hospitalizations are still over stated. COVID-NET hospitalizations are plunging as are state reported hospitalizations (NCHS).
US Covid
All measures of implied deaths from cases, state reported deaths, headline deaths, and excess deaths indicate that the end of Covid is occurring now. That severity has it 18 days to die, the vaccine had nothing to do with the end. US cumulative infected well over 30% of populace now. Herd immunity...
UK Covid
Using excess deaths and not John Hopkins reported headline deaths Covid epidemic may be approaching its end. There are large discrepancies and excess deaths such JHU data is suspect. Excess deaths indicate the second wave was about 50% of the first wave - JHU reports the opposite.
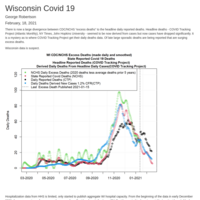
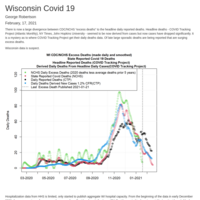
Wisconsin Covid
Seems approaching or at the end of the epidemic.
USA Covid
When plotting current R() (derived from excess deaths and using a .5% infection fatality ratio) against the max R can go to maintain herd immunity threshold based on Smith and Dietz - the USA can be said to be approaching or reached herd immunity threshold.
California Covid
Hospitalizations have dropped 50%. Excess deaths have also turned down.
Unless there is a variant surge, Covid epidemic is likely over for California. California is the last state to have R turn down to below 1.
WI Covid 19
It seems to be over.
Fisher Effect Analysis of US Equity Levels
On a Tobin Q ratio SP (duration matched) to GDP is now 85% rich to such a fair value, while using a Miller CAPM, pricing growth, as there is no no forward growth of GDP SP is now 143% rich. While US Treasurys and Fed policy could raise forward GDP, the move getting their would likely be just as dramatic for equity.
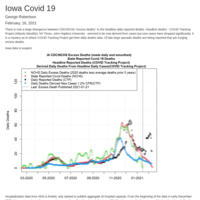
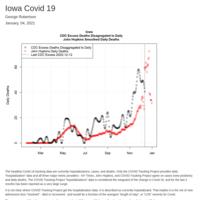
Iowa Covid
Iowa is important to track now as they have avoided suppression measures like lockdowns. Furthermore they have not been frantic to get vaccinations out. Yet despite this Covid peaked in late November to early December and likely has ended for Iowa with well over 30% of the state cumulatively infected.


Fisher Effect Analysis of US Equity Levels
After first deriving a 7 year forward NGDP level and the term structure of annualized change in NGDP by quarter to 7 years, a Tobin Q ratio is considered and then a standard CAPM using the basis, or growth form spot to forward for 7 years.
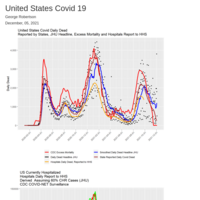
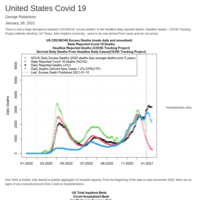
United States Covid 19
Both headline and state reported hospitalizations are dropping quickly whicl the CDC COVID-NET is plunging, down almost 70% since first week of September. Clearly the state reported and the COVID Tracking Project hospitalizations are grossly overstated - likely derived directly from cases.
UK Covid
Covid in UK has peaked end of December. Hospitalization capacity was never seriously challenged. It is doubtful the new variants will be a major change in UK Covid status.
BB Credit is not pricing risk now.
A stochastic analysis of BB credit spread indicates current trading has nothing to do with risk/volatility. If BB credit were to price stochastic risk then spreads would triple. Since risk pricing always moves in regime shifts, this correction could happen in days.

US Equites Valuation Using Tobin and CAPM
Most macro analysis is made with spot GDP to spot equity index vaue. This is incorrect as equity has long duration and current GDP has zero duration. A forward GDP must be derived. Doing so shows US equity will drop 40% if it is to align with Tobin and 50% if a CAPM growth model used.
USA Covid Summary
The third phase in the epidemic peaked in mid December and is ending. The last large geography to begin to end was California.
The quality of the popular and trusted COVID Tracking Project is terrible and veracity is suspect.
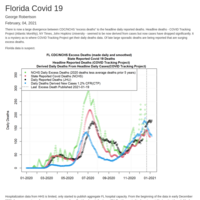
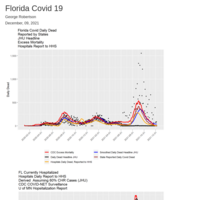
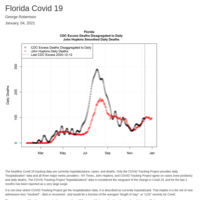
Florida Covid
Health Human Services hospital inpatient Covid occupied data is at odds with popular currently hospitalized data and daily deaths. Also excess deaths surged strangely.
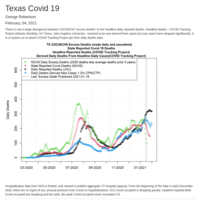
Texas Covid
Texas has continuous "noise" which masks the ending of Covid last December. Even then the Oct to Dec phase was about 50% of the August phase. Popularly reported hospitalizations data seems grossly overstated.
Federal Reserve SMCCF has eliminated price discovery for BB credit.
The SMCCF will be shone to be a disaster. All credit spreads are bizarrely rich/tight. BB credit spreads are now about 1/3 of where they should be to price risk. This will correct at worst time, while all other markets are also crashing.

US Covid 19
US Covid: The data provided is not dependable. In the beginning it was doctored to depict Covid pressures and deaths less that reality, almost always for political reasons, and has last 3 months swung hard the other way to depict it far worse than reality - again for pollical reasons.
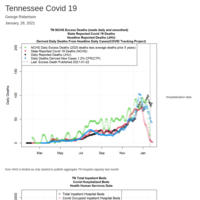
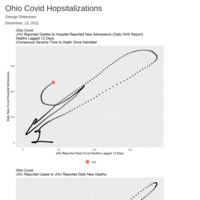
Tennessee Covid
Tennessee hospitalizations and deaths as per CDC/NCHS excess deaths have dropped.
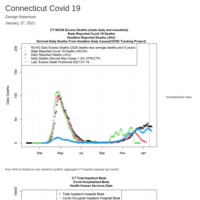
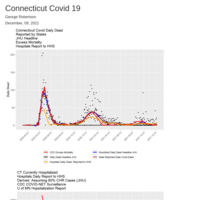
Connecticut Covid 19 Status Report
Covid 19 is over for Connecticut.
There are large discrepancy between COVID Tracking Project data, especially hospitalizations, and reality.
US Equity Valuation Using Forward NGDP Level
Forward GDP (NGDP) level can be derived from volatility and the risk free term structure. Then a "forward" Tobin Q can be applied, the ratio of equity to GDP level. A CAPM approach considering the growth in forward GDP to equity can also be derived. R2000 support via forward Tobin Q is 1300 and 1000 via CAPM.
BB Credit Analysis Using Stochastics/Vol of R 2000
BB credit spread of around 225 over US Treasurys is likely the richest spread in last 50 years. Obviously it is the Fed SMCCF buys. However that fund is being "tapered".
California Covid
It seems to have peaked.
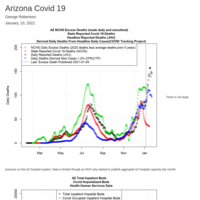
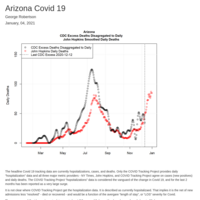
Arizona Covid
Rate of death increase is slowing but still positive.
Note the second phase was for most at a R(0) under 2 - power of exponential growth. What is felt as a sudden increase was on a growth ramp for months but then hit exponential inflexion.
Hospitalizations have turned down sharply and were never seriously pressured.

California Covid
While the epidemic could resume a surge, that normalized daily deaths are well over 4 sigma and that 25% of the populace cumulative infected suggests the epidemic is ending.
USA Covid Review
The final phase has peaked and if pattern of prior two peaks the end of the epidemic comes quickly. Reported deaths seem overstated when calibrated to excess deaths. Currently hospitalized seems to be based on on Case Hospitalization Rate of 60%, about 6 times consensus severity.
Sweden Covid 19
Seems Sweden has turned the corner.
USA Covid Review
Since Oct 15 2020, a few weeks before the election, there has been a obvious overstating of daily deaths and hospitalizations. The overstating .comes from the various state reporting. These deaths are not reflected, to date, in excess deaths and likely are revisions of the criteria in reporting Covid 19 deaths. Since early November there is heightened smoothness and correlation between daily cases and Covid hospitalized such the hospitalization data is no longer in proximity of now well understood proximity. It seems daily reported deaths and hospitalizations are derived from daily case data. Day to day and even week to week Covid 19 data is not accurate and perhaps spurious.
USA Covid Review
While popular private sector data like the COVID Tracking Project continue to show massive increases in hospitalizations and cases, the CDC excess deaths and CDC hospital surveillance COVID-NET show the epidemic is nearing the end. California and Arizona are the only very active states and they seem to be peaking.
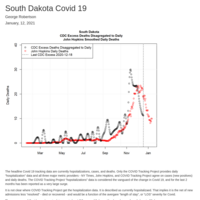
South Dakota Covid
SD was clearly a target for COVID Tracking Project and in November they reported about 6 times the number of actually hospitalized. The open strategy with light mitigation has about 30% cumulative infected which is likely herd immunity threshold.
UK Covid
Excess deaths advanced and confirm the surge, yet report does not confirm the hospitalization concern. That the size of the epidemic March to May is not appreciated and therefor
United Kingdom Covid
Excess deaths do not support the level of concern over Covid by most and media. Covid is likely nearing its end. The headline concern and fears over the NHS hospitalization pressure, being swamped does not appear to be reality.
Lithuania Covid
Lithuania is in a massive surge in Covid, one of the worst experienced in Europe since N. Italy in the Spring. Already, in terms of percentage of the populace infected, have exceeded Sweden.
Germany Covid
Germany is showing how near useless suppression/lockdown strategy. Note that in terms of comparable percentage of population infected, Germany is in far worse shape than Sweden. Germany has not developed societal response to the epidemic and if vaccine current, will be worst of any EU nation shortly.
Sweden Covid
Sweden has at least paused if not ended the recent surge, which was - in terms of new cumulative infections in terms of percentage of population - a fraction of initial surge. Meanwhile most EU nations are surpassing Sweden as constant suppressions leads to lack of control but for more suppression.
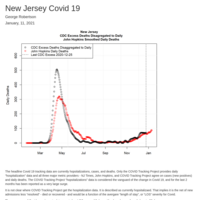
New Jersey Covid
NJ status is one of "long Covid" , the disease just wont quite though the increase in infection is only slight and likely to stay so. Reported headline hospitalizations is not correct and there is only constant low pressure on the system. Is NJ just the ongoing reality for everyone without vaccine?
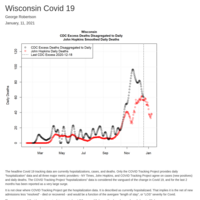
Wisconsin Covid
Wisconsin seems to undercount dead but both reported dead and CDC excess deaths have peaked at 4 sigma and turned down. Hospitalization data by likes of COVID Tracking Project is grossly overstated but has turned down. The epidemic is ending in Wisconsin.
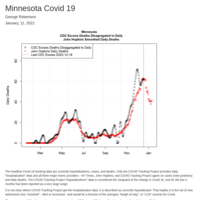
Minnesota Covid
MN seems to withhold reporting mortality to NCHS and thereby producing a current excess deaths report. The last useful date is Dec 18. However reported deaths have started down and both daily reported and latest CDC excess deaths at 4 sigma so has likely topped. Hospitalization indicate epidemic end.
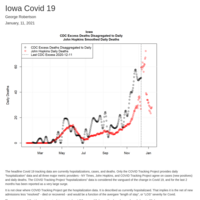
Iowa Covid
Iowa clearly shows the epidemic is coming to an end. Death data seems to be deliberately painted to the worst picture with dramatic Dec 7th revisions on how to calculate Covid deaths by IDPH. Note the constant 5 N plus of daily deaths reported through out December then crashing. Hospitalization data accurate.
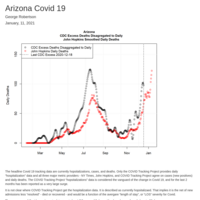
Arizona Covid
Arizona is having a significant secondary surge, but it is secondary with the main phase peaking in early July. Normalized deaths to percentage infected suggest 30% cumulative infected is a herd immunity threshold, but this is not certain. Popular headline data on hospitalization is misleading, about 3 times reality.
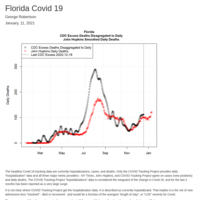
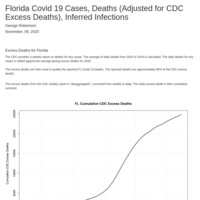
Florida Covid
The Florida Covid epidemic is concluding. COVID Tracking Project data, especially hospitalizations suspect, likely derived from cases and not actual status.
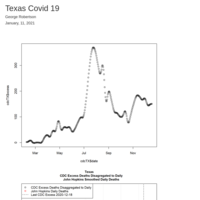
Texas Covid 19 Report
The Texas Covid epidemic is coming to a close, with the peak in July and a secondary peak of half the main July peak in late October. Messy or even falsified data has prevented clarity. The secondary peak was caused by linkage to Mexico and poverty in Rio Grande Valley.
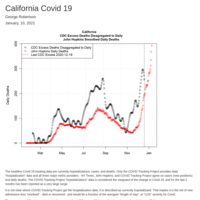
California Covid
The CDC data in both hospitalizations and excess deaths indicate the California epidemic peaked in first and second week of December. This also indicates the headline Covid data, especially hospitalizations from COVID Tracking Project may be spurious.
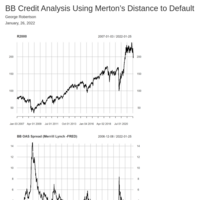
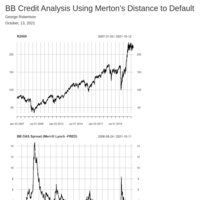
BB Credit poised to triple in credit spread
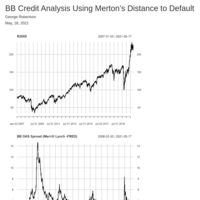
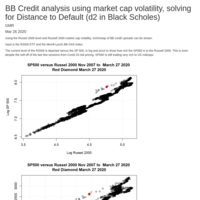
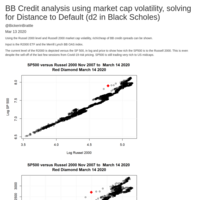
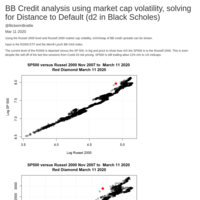
A "distance to default" is derived using R2000 level and volatility.

Fisherian Analysis Between US Treasurys, Equity, and Forward GDP
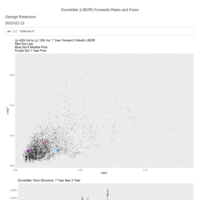
US equity indices have a duration of over 7 years. US Treasurys, volatility and short rates can be used to derive a risk premium and then using the 'Fisher Effect" of Irving Fisher, a forward GDP of 7 years duration can be derived along with the term structure of GDP.

United Kingdom Covid 19
United Kingdom is at or close to herd immunity threshold. The media is grossly misrepresenting this current phase of Covid 19. The pattern of Covid is remarkably similar to Sweden. The above is based on excess deaths and the reported data of deaths is suspect. It seems the qualifiers for counting a Covid death have become looser.

USA Covid Review
USA still has steady gains in cumulative f(x) of normalized deaths to percentage cumulative infected. However the rate of increase is declining when CDC excess deaths are used. Hospitalization data is specious. Case data is a very biased sample.
Germany Covid 19 (Compared to Sweden)
Germany, in terms of stages of epidemics, has now surpassed Sweden in deaths per percentage cumulative infected.
Arizona Covid 19
Daily deaths as reported by John Hopkins, NY Times and COVID Tracking Projects shows large divergence between CDC excess deaths and reported deaths. Reported deaths clearly derived from cases, is not actual if not a fiction. Using CDC excess deaths close to 40% of AZ populace infected, herd immunity has occurred.

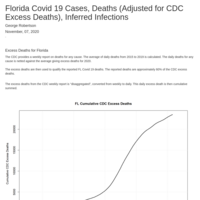
Florida Covid 19 Cases,Deaths,Infections
Like almost all states Florida hospitalizations data provided by COVID Tracking Project seems to be a fiction derived from cases. And in turns cases are not related with new infections. This corruption in Covid data seems to have seeped into daily deaths which are no longer in synch with CDC excess deaths. CDC COVID-NET and excess deaths indicate the FL Covid epidemic is over.
Connecticut Covid 19 Status Report
There appears to be serious flaws with the accuracy of reported deaths and hospitalizations. Hospitalization data seems at best derived if not invented, based upon cases. It is not clear where cases data comes from. However CT is a good example of a US state that has come to "herd immunity threshold".
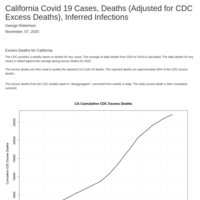
California Covid 19 for 2020
California has been the worse state to report Covid 19 associated deaths with reported deaths 50% to 60% of CDC excess deaths.
A completely different view of where CA is with Covid comes about if CDC excess deaths used. Also appears COVID Tracking Project hospitalizations is derived from cases and is not actual.
United States Covid 19
CDC excess deaths, though lagged last useful data point December 12 2020, has been in 2020 the most reliable metric to track the progression of Covid 19. It seems to have peaked in daily deaths in the first two weeks or December and does not "tie out" with the latest reported deaths.
The popular COVID Tracking Project data on hospitalizations is overstated by threefold when compared to CDC "COVID-NET". COVID-NET also has peaked though last reported date is December 19th.
Lithuania Covid 19
Lithuania is a solid example of how taken by surprise many of the EU nations were with the "surge". However, excess deaths suggest that the surge is just the typical results of exponential growth and that the current began in August.
Germany Covid 19
Germany many is quickly approaching being the worst W European stricken Covid 19 country.
Also is clear this current surge started in last August and then the powers of exponential growth became clear in November. Germany did not see this as masked many Covid 19 deaths as shown by excess deaths.
Sweden Covid 19
Sweden status shown, excess deaths considered, compared to Germany.
Germany is close to replacing Italy as worst Covid experience in Europe.
USA Covid Review
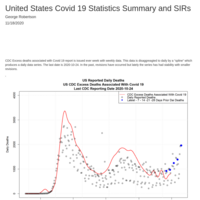
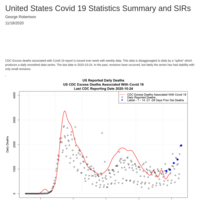
Current Covid status for the USA in terms of cumulative deaths, cumulative infected, percentage of USA cumulative infected, and normalized daily deaths over time and to percentage infected. The reported deaths (JHU, NY Times, and COVID Tracking Project all same now) and CDC excess deaths are used.
Stochastic analysis of BB credit
The Fed has been ordered to end the Secondary Market Corporate Credit Facility (SMCCF). Logically implies BB corporate credit spread will surge to 2X current spreads.
Germany Covid 19
Germany Covid metrics shown and compared to Sweden to gain foresight.
Lithuania Covid 19 with Sweden as Base Case
Lithuania Covid 19 metrics are shown and then compared to Sweden as a base case. Compared to Sweden, Lithuania has a grueling winter ahead and has only started the epidemic.
Changes in 13(3) which is curtailment end of Fed purchase of corp credit
BB poised to to return to 600 over if market stays at current levels, if equity slips at well could go to 1000 over.
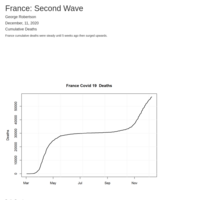
France Covid 19
France is at 15% of the populace infected. Likely this means they can slow and control Covid 19, ending the second wave. (Actual percentage infected is likely much higher as France has large excess deaths exceeding Covid 19 deaths - this is "grim" but good news.
Sweden Covid 19
Sweden seems to have contained the surge. Note this was without any major changes to so called "Swedish Model".
Germany Covid 19
Germany must either completely lockdown or seal borders and pursue a "Swedish Model" Germany has only 5% of populace infected and likely headed to 25%, 5 times the 20,000 deaths to date if they do nothing. Or they completely destroy econ and bring the EU down with them. Or they go to 25% infected but limit deaths to only 2X current if apply Swedish Model.
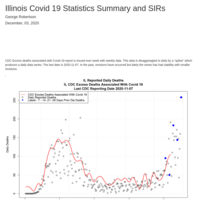
Illinois Covid 19 Status - adjusted deaths for excess (CDC), reported deaths, and 3 SIRs
Illinois is likely the most Covid 19 stricken state. The rest of the country should place them under quarantine - no movement in or out.
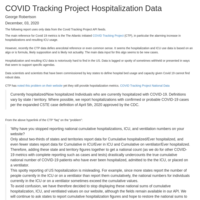
Covid Tracking Project Hospitalization Data
The hospitalization data the Covid Tracking Project provides has become one of the most important variables. However this data seems derived and is not actual.
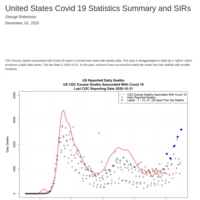
US Summary on Covid 19
Deaths are considered the best indication of covid 19 status considering the bias and thereby lack of statistical significance in "cases". Deaths shown as reported and adjusted by CDC excess deaths associated with covid 19.
Then 3 SIR models provided, using reported deaths, adjusted for excess deaths and with R() unchanging based on latest adjusted deaths calibrated to a standard SIR model.
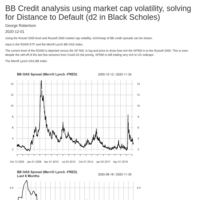
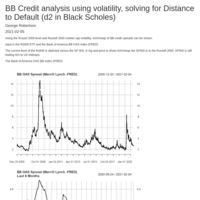
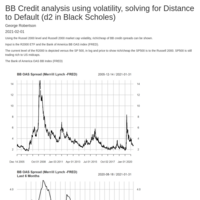
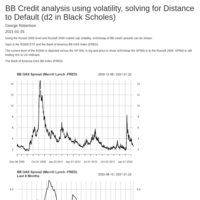
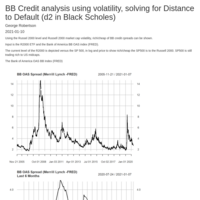
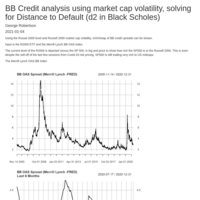
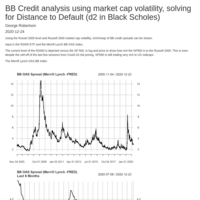
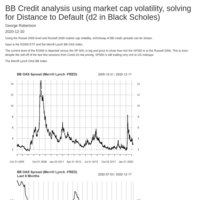
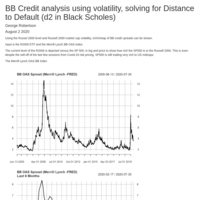
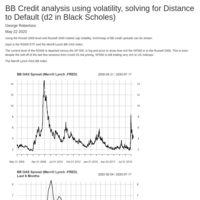
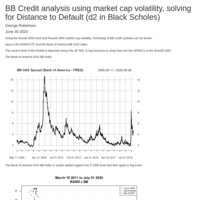
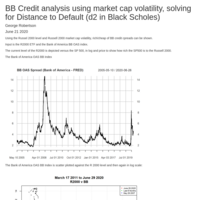
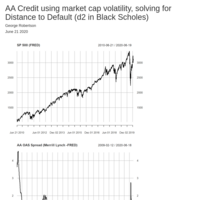
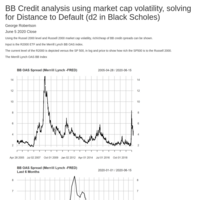
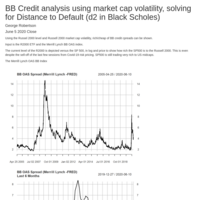
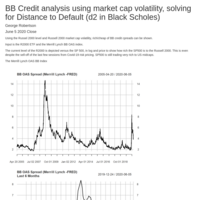
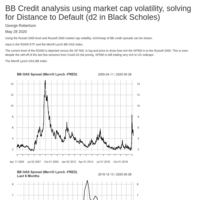
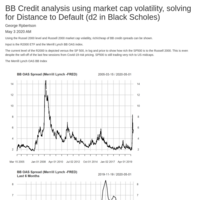
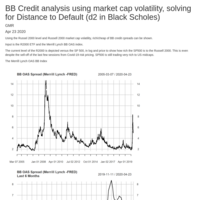
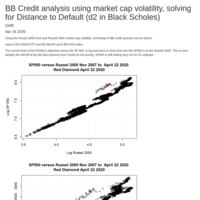
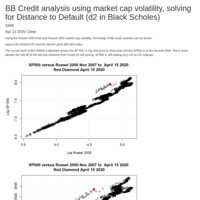
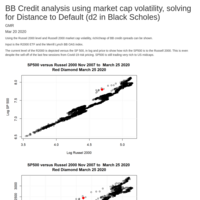
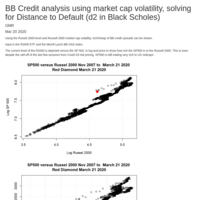
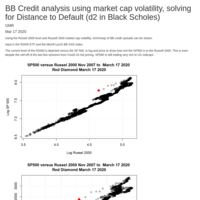
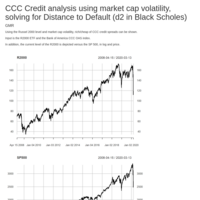
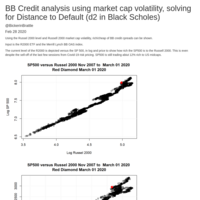
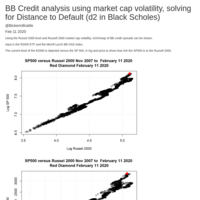
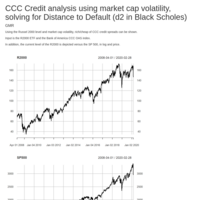
BB Credit analysis using market cap volatility, solving for Distance to Default
"Strange as it ever was...."
The Fed corruption of pricing is obvious. There is no reasonable analysis of credit markets but for this.
Fisher Effect Analysis of US Equity Levels
R2000 support is now well under 1000 and SP500 support is now under 2000. Or, conversely if stocks remain or higher then US Treasury 10 years will move to 4% or higher in yield.
If there is any economic laws akin to Newtonian physics, it is this.
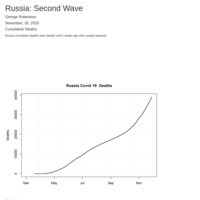
Russia has Covid 19 Raging
Russia is on the brink of a disaster as it moves towards winter.
Sweden Covid 19
Sweden now has an R(0) of less than 1 given the decline in daily deaths.
That Sweden was at effective herd immunity allowed Sweden to contain the recent import of Covid 19.

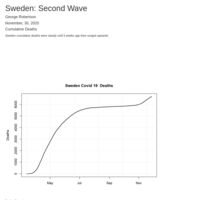
Sweden Current Covid 19 Status
Sweden has turned the corner and returning to sub 1 R(0) . Sweden showing it can "manage" Covid 19 without suppression indicates their approach has to be considered. If they are not at herd immunity threshold, they are in proximity.
Sweden Covid 19 Deaths
Sweden
US Covid 19
It is a mistake to consider one geography heterogeneity is or will be different from another. A common way to measure this similarity is percentage of the area populace infected applying a uniform .5% IFR. Some intuitive differences can be applied based more or less on elder care. US has "only" 15% of populace infected and will go to at least 30% without vaccine.
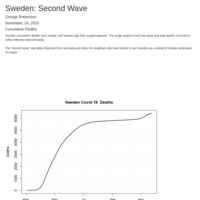
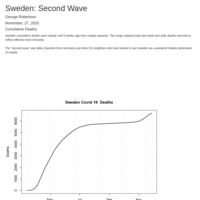
Sweden: No Second Wave
Sweden is back to a norm of very low deaths per day.
The surge was likely imported from EU neighbors who started to use Sweden as a weekend holiday destination of normalcy and respite from their own.
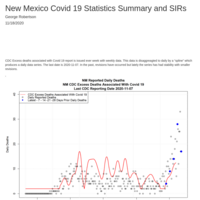
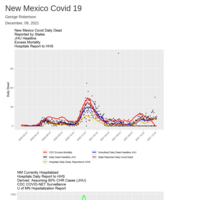
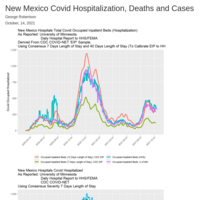
New Mexico Covid 19 Statistics Summary and SIRs
New Mexico is clearly midway with a surge in Covid 19. There is no end in sight but the % of New Mexico populace cumulatively infected is above 15%. For other areas the virus has slowed at this point but only if reasonable mitigation has become habitual (masks, sanitation, and common sense in terms of distance). Testing has become more effective as shown with the correlation to lagged deaths and cases.
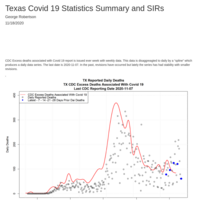
Texas Covid 19 Statistics Summary and SIRs
The outright and characteristics of reported dead and dead adjusted for CDC "Excess Deaths Associated With Covid 19" diverged in October. In the past the adjusted for excess deaths have been steady and reliable. Texas "second wave" may be over.
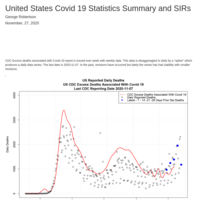
US Covid 19 metrics and 3 SIR models - "Reported Deaths" 'Adjusted Deaths" "SIR Model"
The US will shortly have a large drop in reported daily deaths down towards 600 a day. The end of the Covid 19 epidemic will be perceived before the end of 2020. There is a large divergence between CDC weekly report on Excess Deaths Associated with Covid 19.
Lithuania
Lithuania in a most serious crisis, Poland is in almost as bad a way so wont be able to help and to lesser degree Germany. LTU will need to appeal to either Russia or the US for rescue. 60,000 new infections last 5 weeks will need 7000 ICU - they have excess ICU prior to Covid 19 of 4000. Furthermore likely only 1/10th the way into the epidemic.
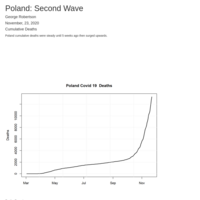
Poland in dire Covid 19 emergency
Poland has 13,000 CV19 dead and 10,000 new dead in only the last 4 weeks. Poland either severely locks down and waits for the vaccine or deaths will continue to 60,000 to 90,000 dead which at current rate will be by Feb 2021. The steep ramp of increase indicates that even light mitigation is not being applied.
Germany Covid 19
Germany surge may possibly be ending and daily deaths returning to low single digits. However this will end with the percentage of Germany cumulative infected at 5%. It seems with mitigation the percentage infected where suppression is not required is 16% or higher. Germany must lockdown and hope the vaccine or deaths to date will triple.
Sweden Current Covid 19 Status
Sweden's daily deaths lagged are not correlated to daily confirmed cases. And the daily deaths did go up recently from low single digits to 25, but have returned to no significant new deaths. Likely Sweden reached herd immunity.
US Covid 19
Summary of deaths, adjusted deaths by CDC Excess deaths, and SIR models based on reported dead, adjusted dead, and calibrating last cumulative adjusted death to the model and solve for average R(0). Closes with volatility of reported dead to Susceptible and CDC Excess Deaths to Susceptible.
United States Covid 19 Status
The United States currently has 15% of the populace infected with CI of 12% to 23%. The large states yet to resolve are California and Texas. There is a divergence between CDC reported excess deaths and reported deaths which has to resolve in the next 3 weeks.
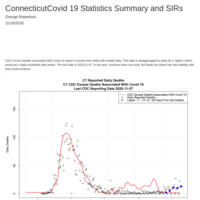
Connecticut Covid 19 Status Report
Connecticut had the cleanest data for Covid 19 of any state until the first week of October. Then reported deaths increased while CDC Excess Deaths report flatlined.
California Covid 19 Stats
There is a disconnection between cases and reported deaths with deaths adjusted for CDC excess deaths. Either we have a second wave or this simply a mania urged along by politics and test case sales men. The next two weeks will be telling.
Texas Covid 19 Report
Texas is the epidemic center now, like New York was in March and April. Of the large states it is the only state showing a large surge in infection. This is at odds with the usual progression of an infection.
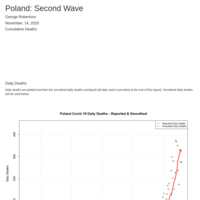
Poland Having a Large Surge of Covid 19
Poland has correlation between cases and lagged deaths. This indicates the current surge in cases shows a surge in Covid 19.
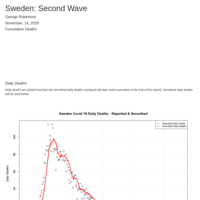
Sweden is not having a surge in Covid 19
Sweden has had little change in an already very low daily death rates. Cases are not correlated with deaths both current and lagged 18 days. Likely Sweden entered herd immunity last summer and has maintained that despite neighbors like Germany surging.
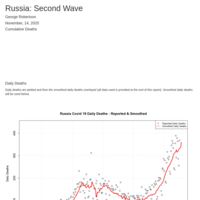
Russia has Covid 19 Raging
Russia is surging with Covid 19 with over 2000 a day in deaths and high correlation of cases to deaths. This means cases are indicative of Covid 19. Cases are surging.
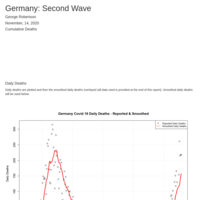
Germany in a significant surge, a "second wave"
In Germany cases are correlated to deaths lagged 18 days. Therefore the large surge in cases to date indicate a large surge in covid 19.
Fisher Effect Analysis Qualifying US Equity Levels
Either long US Treasurys drop 50% in value, or US Equity drops 40% in value. Perhaps a combination of both. The US will enter the largest movements in core asset values which to many will be catastrophic. There will be a loss of 30% to 40% in most pensions and insurance pools of savings. There is no way to hedge.

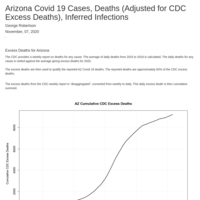
Arizona Covid 19: Cases, Deaths, Infections
Arizona cases has a high correlation to deaths and inferred infections. AZ has a significant spike in Covid 19, a real Second Wave.
California Covid 19: Cases, Infections, Deaths
There is no spike in Covid 19 infections in CA, and likely CA is weeks away from herd immunity threshold. There was a massive spike in testing and resulting cases just before the election.
United States Covid 19: Cases, Deaths, Infections
There is no second wave in Covid 19, there is no spike in infections. There has been a massive spike in cases, orchestrated or not, which is giving an erroneous picture of Covid 19 presently. Covid 19 is close to ending in the US.
Florida Covid 19 Cases,Deaths,Infections
Florida is at herd immunity threshold. 1-1/R .There is no relationship of new cases spike to inferred infections and deaths. It appears the cases spike was related to the election.
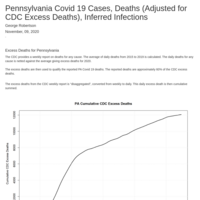
Pennsylvania Covid 19: Cases, Deaths, Inferred Infection
PA is at or close to herd immunity. A massive spike in daily new cases over last month does not relate to the small increase of inferred infections and deaths. There is no 2nd wave in PA. The timing to election makes cases increase suspect.
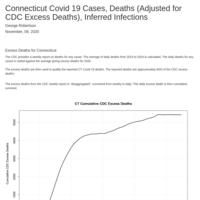
CT Covid 19 Deaths Infections Cases
There is a slight increase in Covid19 shown by slight increase of deaths. The percentage of reported deaths to CDC excess deaths indicates the reported deaths was perhaps intended prior to the election. The slight increase of deaths results in a slight increase in inferred infection. New cases is so massive increase just before the election shows little relationship to the above slight increase.
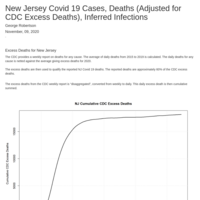
NJ Covid 19: Cases, Deaths, Infections
NJ has reached effective herd immunity threshold (HIT) where R(0) has been stable for several weeks and then used in the Smith/Dietz HIT formula:
1-1/R

In the US,there is no surge in Covid 19
The current focus on "cases" is misplaced as the testing is biased and too small to have statistical significance.
Covid 19 since September has been on a gradual downtrend and will be effectively over by the end of this year.
The US percentage of infected has hit 14%, about the same percentage Sweden reached when they had effective herd immunity.
No Second Wave in Sweden
There is no Covid 19 surge underway in Sweden, no “second wave”.
Covid 19 to date has reached an effective “herd immunity threshold”, or at least a long lasting steady R(0) such that deaths have plateaued showing an effective end of the epidemic.
However much notice has been given to a 700% surge in daily new cases, which has it a given that a Covid-19 surge is underway.

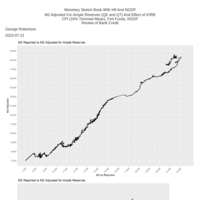
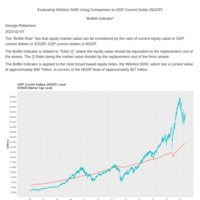
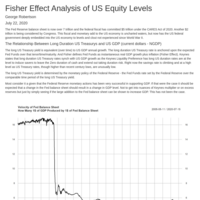
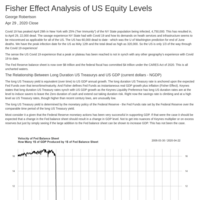
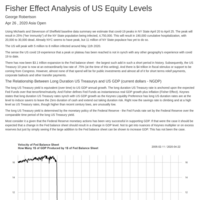
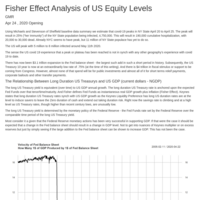
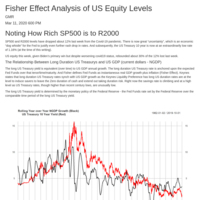
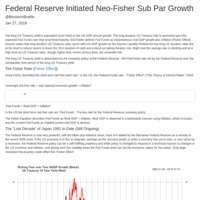
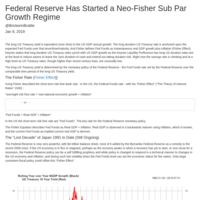
Fisher Effect Analysis of US Equity Levels
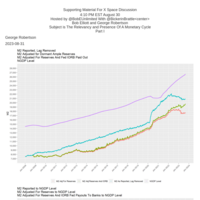
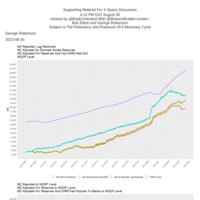
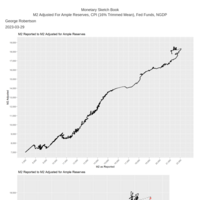
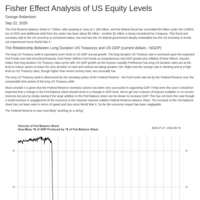
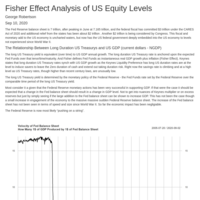
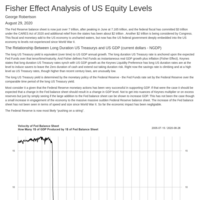
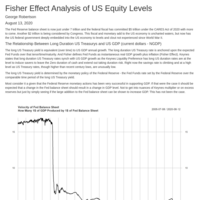
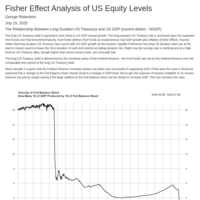
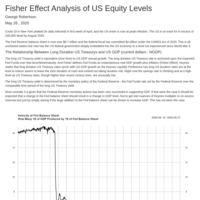
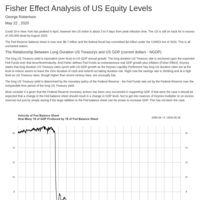
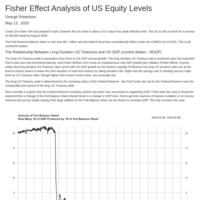
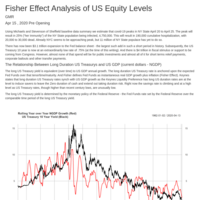
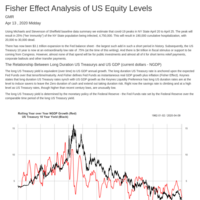
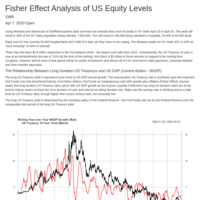
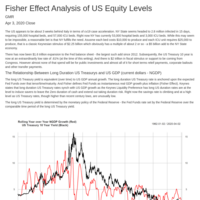
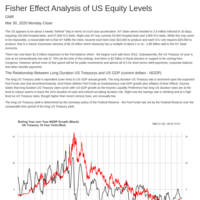
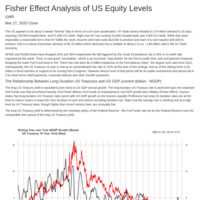
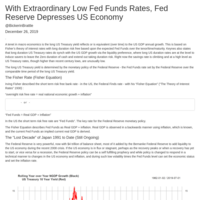
The Relationship Between Long Duration US Treasurys and US GDP (current dollars - NGDP)
The long US Treasury yield is equivalent (over time) to US GDP annual growth. The long duration US Treasury rate is anchored upon the expected Fed Funds over that tenor/time/maturity. And Fisher defines Fed Funds as instantaneous real GDP growth plus inflation (Fisher Effect). Keynes states that long duration US Treasury rates synch with US GDP growth as the Keynes Liquidity Preference has long US duration rates are at the level to induce savers to leave the Zero duration of cash and extend out taking duration risk. Right now the savings rate is climbing and at a high level as US Treasury rates, though higher than recent century lows, are unusually low.
The long US Treasury yield is determined by the monetary policy of the Federal Reserve - the Fed Funds rate set by the Federal Reserve over the comparable time period of the long US Treasury yield.
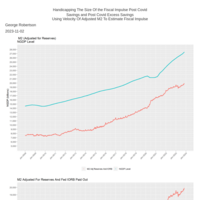
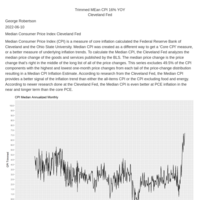
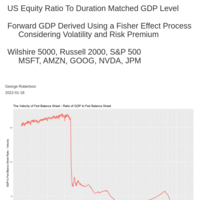
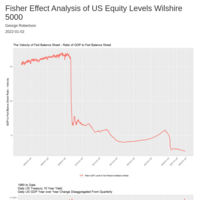
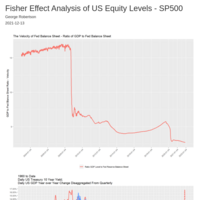
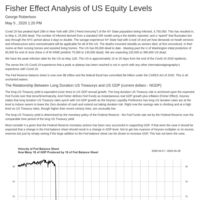
Most consider it a given that the Federal Reserve monetary actions has been very successful in supporting GDP. If that were the case it should be expected that a change in the Fed balance sheet should result in a change in GDP level. Not to get into nuances of Keynes multiplier or on excess reserves but just by simply seeing if the large addition to the Fed balance sheet can be shown to increase GDP. This has not been the case though a small increase in engagement of the economy to the massive massive sudden Federal Reserve balance sheet. The increase of the Fed balance sheet has not been seen in terms of speed and size since World War II. So far the economic impact has been negligiable.
The Federal Reserve is now most likely “pushing on a string”.
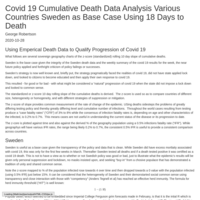
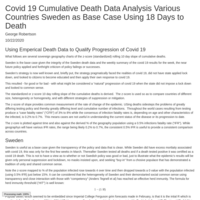
Covid 19 Cumulative Death Data Analysis Various Countries Sweden as Base Case Using 18 Days to Death
Using Emperical Death Data to Qualify Progression of Covid 19
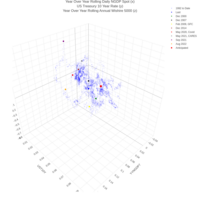
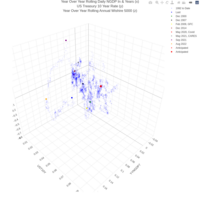
What follows are several sovereign geography charts of the z-score (standardized) rolling 10 day slope of cumulative deaths.
Sweden is the base case given the integrity of the Sweden death data and the weekly summary of the covid 19 results for the week, the near future policy applied and forthright criticism of policy failings or successes.
Sweden’s strategy is now well known and, briefly put, the strategy pragmatically faced the realities of covid 19, did not have state applied lock down, and looked to citizens to become educated and then apply their own response to covid 19.
This resulted - for good or for bad - with what might be considered a “natural” progression of covid 19 when the state did not impose a lock down and looked to common sense.
The standardized or z-score 10 day rolling slope of the cumulative deaths is derived. The z-score is used so as to compare countries of different size, heterogeneity or homogeneity, and with different strategies of suppression or mitigation.
The z-score of slope provides common measurement of the rate of change of the epidemic. USing deaths sidesteps the problems of greatly differing testing policy and thereby greatly differing level and cumulative number of infections. Throughout the world cases resulting from testing produce a “case fatality rates” (“CFR”) of 3% to 8% while the consensus of infection fatality rates is, depending on age and other characteristics of the infected, is 0.2% to 0.7%. This means cases are not useful in understanding the current status of the disease or its progression to date.
The z-core is plotted against time and also against the derived % of the geography population using a 0.5% infections fatality rate (“IFR”). While geographys will have various IFR rates, the range being likely 0.2% to 0.7%, the consistent 0.5% IFR is useful to provide a consistent comparison across countries.
A simple but robust use of cumulative deaths to understand the progression of covid 19.
"Herd Immunity" is a hot topic now. Does the progression of deaths have a repeated pattern such that there is indication of herd immunity.
Simply put, if herd immunity is the state where infection and thereby deaths increases at a small if not "0" rate, and that is likely sustainable, then herd immunity has been reached.

SP500 is about 50% overvalued and R2000 is about 30% overvalued. The Federal Reserve has plunged the US into a "Japanification"
The full might of a Federal Reserve, with greatly increased powers since the 2009 crisis and with a complacent Congress that does not provide oversight combined with bellicose pressure from the President, has contorted the US term structures of volatility, Fed Funds, and riskless US Treasury rates right out to the longest duration US Treasurys. The Federal Reserve balance sheet is now 1/3 in size as US GDP and Fed Funds are approaching "Zero Interest Rates Policy" as well as the Fed providing intense forward guidance that they will commit to ZIRP for the foreseeable future. The Federal Reserve is also showing impotence to effect inflation or growth. The results is the US economy has entered Japanification. Using Fisher Effect logic a forward term structure us constructed for GDP levels which show obvious peril the Federal Reserve has made for the US.
Using a forward "fisher effect" derived NGDP to qualify US equities
If SP500 is qualified by a Tobin Q type of process using 7 year forward NGDP, support is around 2200. If a Sharpe et al process is used (CAPM) then support is 1600. Forward NGDP level implies a 30% to 50% drop in SP500 given the current Japanification imposed by the current Federal Reserve monetary policy.

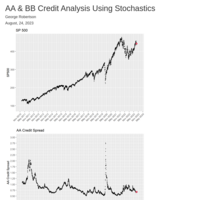
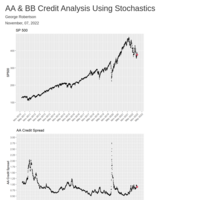
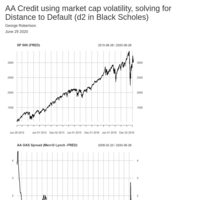
AA credit considered in terms risk (asset volatility)
As qualified by asset volatility, AA credit spread is now at historical tights/rich. Potential for spreads to suddenly widen by 3 or 4 times current spreads.

AA Credit evaluated using a long term asset risk - vol of assets expressed as d2
The degree to which the Fed has eliminated all price discovery for credit is amazing.

Using Fisher Effect to qualify US equity 9 16 2020
A forward "Fisher Effect" readily shows the Japanification the Fed has forced the US economy into. Compared to the forward NGDP level (out to seven years) to the current -.25% for next seven years now, 11.2 trillion in US future NGDP level has been lost since Dec 2018
Fisher Effect used to consider US equity 9 10 2020
It is difficult to argue against the "Fisher Effect", that NGDP instantaneous level of change is equivalent to effective Fed Funds. A term structure of Fed Funds is constructed out to 7 years. A Tobin Q like process is applied to SP500 and Russell 2000 levels.


US Equity versus 7 year forward NGDP level
If growth is not considered SP500 support is around 2200. If growth is a factor (CAPM etc) SP500 support is well below 2000.
Fed has completely corrupted credit, eliminating price discovery
This cannot have a good outcome. Based on risk, AA credit should be trading 200 to 300 over based on relationships shown for last century.
Fisher Effect Analysis of US Equity Levels August 29 2020
There has never been such disharmony between US Treasurys and US equity. My read is US equity set to drop 30%.

AA credit analysis using stochastics
The Fed has destroyed price discovery for all US credit and currently AA credit trading at historical risk adjusted highs. Calamity likely to occur.

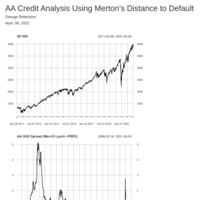
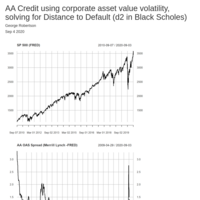
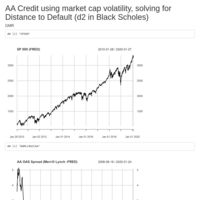
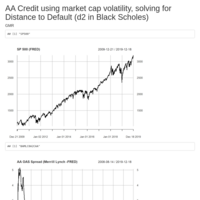
AA Credit using corporate asset value volatility, solving for Distance to Default (d2 in Black Scholes)
Likely, in terms of risk as measured by volatility, AA credit is trading at a once a century credit spread tight. AA is bizarrely overvalued now and poised to have a sudden massive spread widening unless the Fed permanently rations and administrates credit price.

August 23 "Fisher Effect" based analysis of US equity. George Robertson
It is probable that the Federal Reserve has evoked a "Japanification", or a "Lost Decade", similar to what Japan experienced from the 1990 crisis well in the 2008 crisis. This will mean that the Fed stimulus in response to covid-19, that was not a classic Bagehot "discount window" solvency action lending freely against "good collateral", will cap if not offset the CARES Act fiscal policy.

Fisher Effect Analysis of US Equity
The Fisher Effect of Irving Fishers theory of interest rates has never been at such odds with US equity levels. Either US risk free will have a dramatic rise in yield or equity will have a dramatic drop in value.
Fisher Effect used to value US equity.
Sooner or later US equity markets will be in synch with US NGDP and US NGDP will be in synch with the term structure of rates and vol for US Treasurys.

Analysis of AA credit spreads using stochastic
Credit will always, in the end, trade at spread levels to price risk to default. The forward looking value that measures default risk is the credit corporations asset volatility. Currently the risk to default of AA credit should require a 350 basis points spread over US Treasurys.

Using stochastics to qualify BB credit spread
Credit spread always aligns - sooner or later - with the risk of default. Volatility of the corporate asset value measures this risk.
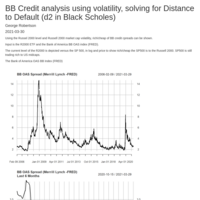
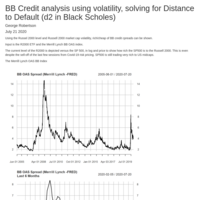
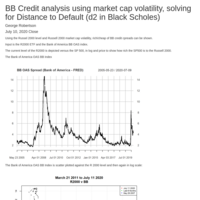
BB Credit analysis using volatility, solving for Distance to Default (d2 in Black Scholes)
BB Credit analysis using volatility, solving for Distance to Default (d2 in Black Scholes)
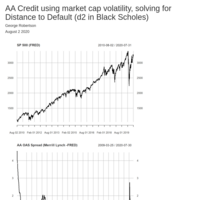
AA Credit using market cap volatility, solving for Distance to Default (d2 in Black Scholes)
AA Credit using market cap volatility, solving for Distance to Default (d2 in Black Scholes)

Using Fisher Effect to qualify SP500 via a forward Sharpe Ratio consideration
Support for SP500, if it is to have relationship to forward NGDP level and the growth form now to that forward (the 'basis") has support at 1500 to 1700, down 50% to down 40%.
Fisher Effect Analysis of US Equity Levels
If the Fisher theory of interest rates, the 'Fisher Effect" has relevancy in forward NGDP levels, and along with the riskiness as shown by the risk premium. 7 year forward NGDP level and the basis, the difference of 7 year forward NGDP level to concurrent NGDP level - if this has any relationship to the US equity market SP500 support is 1500 to 2000.
BB Credit analysis using volatility, solving for Distance to Default (d2 in Black Scholes)
Likely the richest, in terms of default risk, credit has ever traded in US financial history. What could go wrong?
BB Credit analysis using volatility, solving for Distance to Default (d2 in Black Scholes)
R2000 realized volatility for last year is translated to realized asset vol which in turn is used to derive how far from ruin in years the R2000 firms. This is the "d2" in Black Scholes Merton as used by Merton termed "distance to default", D2D. BB credit is trading at unusual rich (tight spread) in relationship to default risk.
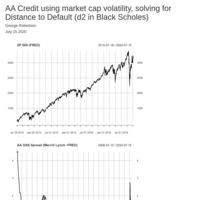
AA Credit analysis July 16 2020
The Fed SMCCF has driven AA spreads qualified by risk of default to record tightness.

BB Credit July 11 2020
Fed can obviously muscle prices with SMCCF, but it cannot lessen the risk of default.

Using Fisher Effect to qualify equity. July 9 2020
The implied forward level of NGDP (7 years) has cratered. If growth of the US economy is part of SP500 valuation, that level is now around 1500 to 1800.

BB credit spreads qualified by risk to default based on volatility July 8, 2020
While the Fed has made a dramatic change on market prices of credit, they cannot answer the ever increasing default risk - unless they plan to guaranty the firm itself. A dangerous situation is created which likely leads to a crash in credit and discrediting of the Fed.

BB Credit at likely all time tightness in terms of default risk - July 3 2020
BB credit seems to be in synch if not cheap in relationship to equity - this report looks to the R2000 and the BOA BB OAS index. But in terms of default risk BB is likely at historically rich levels.
"Fisher Effect" Analysis of SP500 and R2000
Deriving a 7 year forward NGDP level, a Tobin Q is used to consider R2000 which suggests support is 1200 or lower (currently R2000 at 1430), and for the SP500 support is below 2000 (currently SP500 at 3050). The risk premium is rising quickly to around 20 basis points, showing the greatly increased risk the Fed has imposed on the market.
BB credit spreads set to double or perhaps triple. June 30, 2020
BB credit spreads set to move from 450 basis points (BOA BB OAS Index) to 800 basis points to 1200 basis points. Risk of default has worsened despite Fed extraordinary SMCCF purchases of credit. "Distance to Default" for Russell 2000 index now below 2.
AA credit considered in terms of risk of default, AA credit spread poised to triple June 29 2020
The Fed has dramatically made AA credit richer with recent purchases both directly and via ETFs. This will likely be the worst policy error the Fed has ever made for while technical demand supply has been disrupted by the Fed. the risk of default is now worse than in 2009 to 2012.
Using volatility to qualify BB credit spread June 29 2020
While Fed purchase of junk and other credit ETF, then corporate credit itself, dropped BB credit spread by about 400 basis points from wides of 800 basis point before Fed intervention, the risk of default has not been reduced. BB credit set to double in spread back to 800 basis points and then wider as per risk of default.
SP500 support on forward Tobin Q support now 1800, using a forward CAPM of NGDP support now 1400 June 24 2020
Using the forwards and term structure of volatility, a term structure of the risk free instantaneous rate, Fed Funds, is constructed out to 7 years. Then using the "Fisher Effect" of real GDP + inflation = Fed Funds, a term structure out for 7 years is constructed. US forward NGDP versus "nowcast" GDP is at a negative, likely a historical record dismal status.

Using a 7 year"Fisher Effect' term structure the 7 year forward NGDP is derived. A Tobin Q logic and CAPM use of growth used to qualify SP500 June 22 2020
SP500 support considering a Tobin Q logic has support for SP500 at 1800. Using a CAPM approach incorporating growth, SP500 support now at 1500.

US equity levels qualified by NGDP level in 7 years June 21 2020
A 7 year forward of NGDP level can be derived by applying a term "Fisher Effect". When a Tobin Q like analysis comparing equity levels to this 7 year forward NGDP level, support for the R2000 is around 1100 and for the SP500 at 1900. If a CAPM apporach is considered, the growth from spot to 7 years forward NGDP, the basis, R2000 support is 700 and SP500 is around 1500.
AA Credit qualified stochastically using asset volatility June 21 2020
Likely AA credit has never traded richer in terms of default risk. AA spread set to 3X to 10X widen in spread.
June 19 Neo Fisher determination of term NGDP level out to 7 years
A term Fed Funds instantaneous rate is derived out to 7 years. (Note this is not the OID swap.) Then using the Fisher effect this forward term structure of Fed Funds is used to construct a term structure of NGDP level. In turn, this NGDP 7 year forward level is used to qualify current SP500 and R2000 levels.
Stochastic analysis of BB credit spread June 15 2020
Using volatility of the R2000 (realized 240N), the R2000 asset volatility is derived and thereby the distance to default for the R2000. The Fed SMCCF announsement to purchase junk ETF in April and then their purchase for the SMCCF caused a large rally in BB credit. But the riskiness in terms of volatility was unchanged. So the spread started to re-widen. The June 15th announcement that the SMCCF will buy corporate bonds did not retighten spread.

Using a forward term structure of Fed Funds (out to 7 years) Fisher Effect used to qualify US equities June 14 2020
Most have in forefront current GDP (nominal) in a Tobin Q like frame to consider current SP500. This approach has large duration mismatch (7 years plus for indices like SP5000 while "nowcast" current GDP has "0" duration) but is overlooked as GDP has been steady and growing enough. However all has changed and for first time in recent history, the basis between a derived 7 year forward NGDP level and current GDP level has gone sharply negative.

Using Fisher Effect to qualify equity June 11 2020
First a terms structure of Fed Funds is constructed out to 7 years. Then using the "Fisher Effect" a 7 year forward level of NGDP is derived. This in turn is used to qualify US equities on Tobin Q like thought.
BB Credit June 11 2020
BB credit qualified by the risk that default occurs (using the stochastic Black Scholes "d2") is near historical tights and the ETF purchased by the Fed that have junk credit are at historical highs. BB credit as much as 25% overvalued.
BB Credit Spread Likely At Historical Tight, Set to Triple in Spread to 1200 Basis Points.
While the Fed has bought BB Credit via ETF and crushed the spread, they cannot change the default risk, Default risk is unchanged as measured by how far from default in years given risk/volatility.
Forward "Fisher Effect" Used to qualify US equity. June 5th 2020
Forward NGDP level in 7 years and growth of NGDP to that level from now until then, suggests SP500 now ready to drop 50%, or US Treasurys 10 year required to back to 5%.

Using 'Fisher Effect' to derive a 7 year forward NGDP then evaluate US equity.
Most only look at spot or "nowcast" US GDP in current dollars (by definition NGDP) to qualify current equity levels. However equity has a "duration" which is conceptual but at least 7 years. Comparing a 7 year duration to a 0 duration is apples to oranges. A 7 year forward of spot nowcast GDP must be derived out to 7 years to compare GDP to US equity.

Stochastic Analysis of BB Credit 6/2/2020
The Fed purchase of credit D2D has tightened spreads dramatically, yet the riskiness of the credit has not changed. The default risk is unchanged.
Using Distance to Default (D2 in MBS - how far from ruin/default in years) to Qualify BB Spread
No amount of Fed purchase of credit can reduce default risk.
Fisher Effect Analysis of US Equity Levels May 28 2020
Forward expected nominal GDP level in 7 years is now not about the same as 2017, erasing 3 years of expected growth. Trump is likely in office with the largest future loss of expected nominal GDP in history. Forward expected nominal GDP level in 7 years, about same duration as SP500 can only support a 2000 to 2200 SP500 level.

May 26 20; BB Credit analysis using market cap volatility, solving for Distance to Default (d2 in Black Scholes)
BB credit spread is perhaps the richest or lowest spread qualified by risk in the last 30 years.

Fisher Effect to qualify US equities May 27 2020
A Fisherian analysis has it, that the US Treasury rate curve and US GDP and US risky assets like R2000 or SP500 will, over time, be in synch.
It is probable that the Federal Reserve has evoked a "Japanification", or a "Lost Decade", similar to what Japan experienced from the 1990 crisis well in the 2008 crisis. This will mean that the Fed stimulus in response to covid-19, that was not a classic Bagehot "discount window" solvency action lending freely against "good collateral", will cap if not offset the CARES Act fiscal policy.

Using Fisher Effect to construct a term structure of NGDP level and annual growth for next 7 years.
A 7 year term structure of NGDP level and annual growth is derived using a "Fisher Effect" framework. Indicates SP500 can drop 50% given a Tobin Q like consideration.
Fisher Effect Analysis of US Equity Levels May 22 2020
Prior to crisis, SP500 able to access Chinese mercantalism and international tax scofflaw strategies already 25% rich to those US equity which could not follow. That along with the Federal Reserve exiting from monetary policy with incredible low "perma" low rates, has forecast a 1/2% to 1% NGDP growth for the US for the next 7 years. US equity poised to drop 30% to 50% (for the international stocks) unless Fed returns to economic monetarism orthodoxy of Keynes/Fisher/Minsky/Friedman.

Fisher Effect Analysis of US Equity Levels for May 22 2020
Kitchen sink of approaching 7 trillion between extraordinary Fed ease and various QE, along with massive federal CARES Act rescure has politicized US equity, and the world. Prior to crisis SP500 able to access Chinese mercantalism and international tax scofflaw strategies already 25% rich to those US equity which could not follow. That along with the Federal Reserve exiting from monetary policy with incredible low "perma" low rates, has forecated a 1/2% to 1% NGDP growth for the US for the next 7 years. US equity poised to drop 30% to 50% (for the international stocks) unless Fed returns to economic monetarism orthodoxy of Keynes/Fisher/Minsky/Friedman.

BB Credit analysis using market cap volatility, Distance to Default (d2 in Black Scholes)
The Fed via purchasing credit ETF has, as to be expected, prompted a large tightening of credit spread. (Here BB ML OAS index used.) However the Fed action has not changed the firm volatility and has reached limit. Likely, unless volatility drops, BB spreads will return to wides.
May 13 2020 Analysis of US Equity using a derived terms stricture of GDP
The Fisher Effect depicts Fed Funds, over the long run, as real GDP growth plus inflation, or the growth in nominal GDP. Using well understood fixed income analysis a forward term structure of Fed Funds is derived and then the Fisher Effect, or Fisherian analysis is used to build a term stucture of NGDP to 7 years. This is used to value, similar to a Tobin Q logic, the US equity markets.
May 5 2020 Fisher Effect Analysis of US Equity Levels
The Fisher Effect states that Fed Funds are equivalent to instantaneous real GDP and inflation. A 7 year term structure of GDP is then derived and used to qualify SP500 and R2000 levels with Tobin Q logic with the duration of current equity levels compared to 7 years forward GDP level and the "basis" or growth of GDP level versus current level.
Close May 3 2020 BB Credit Report
Spreads set to widen substantially. Volatility will, in the end, determine credit spreads not supply demand (Federal Reserve purchases). However, if 2008 is any indication, credit can stay in this area until volatility increases even from these high levels. George Robertson

Using a term structure of the "Fisher Effect" rate (out to 7 years) to qualify US equity levels. May 1 2020
The Fisher Effect has Fed Funds equal to instantaneous Real GDP plus Inflation. Most see the Fisher Effect rate being derived but Neo Fisher though has it that of the Fed is a significant part of the US GDP level size, the Fisher Effect can end determining Real GDP and Inflation. A term structure of Fed Funds can be derived which in turn gives a term structure of Nominal GDP, which in turn with a Tobin Q like approach qualify US equity levels. Currently this model finds US equity levels 20% to 30% over priced.

"Fisher Effect Analysis of US Equity Levels"
Using the well known "Fisher Effect" to construct a term structure of GDP. This in turn is used to qualify US equity levels which are found to be 25% to 35% high.
Fisher Effect analysis of US equity markets.
The entire US risk free market place - about $17 trillion in size - predicts that the US will have almost no growth in GDP for the next 7 years. A 7 year term structure of nominal GDP is derived using the Fisher Effect. It is difficult to see how US equity do not trade to a Tobin Q and trade down another 30%.
Fisher Effect analysis applied to US GDP and thereby US equities.
While the shock of covid 19 is massive, the Federal Reserve has evoked slamming the door on the US economy preventing future growth via the "Fisher Effect". Us equity markets will reflect this over time.
Fisher Effect Analysis of US Equity Levels April 24, 2020
Fisher Effect Analysis of US Equity Levels
Using a term structure of GDP out to 7 years using the "Fisher Effect". US index equity levels are then qualified by this 7 year forward GDP level as well as the 7 year basis of GDP level. The 7 year basis of GDP level is the 7 year forward less the current GDP level - or "growth" of GDP for next 7 years.
BB Credit Stochastic Credit Spread Analysis
While the Fed purchase of risky assets has driven credit spreads tighter - in the end volatility (stochastics) always determine credit spreads.
BB Credit Analysis - April 22 2020
Using a stochastic approach, BB credit is likely rich now and could double in spread. This time around the Fed can purchase BB credit via ETF, but it cannot drop volatility. Therefore the Fed purchases will have little effect in the end,
Fisher Effect Analysis of US Equity for April 22, 2020
A report on the relationship between the term and vol structure of US risk free rates, for the most part determined by the Fed given absence of inflation, and the US GDP level 7 years forward. This in turn is used to consider the current levels of US equity. It suggests US equity set to drop another 20% to 30%.

'Fisher Effect' used to qualify US Equity; SP500 30% rich, R2000 20% rich (April 21 2020)
The well known Fisher Effect, or Fisher equation is used to derive a term structure of Fed Funds and thereby a term structure of current GDP (NGDP) out to 7 years. This then allows a more apples to apples duration match of GDP to current US equity index levels.

"Fisher Effect" analysis of US equity levels.
Die to the incredible Fed Reserve actions, which have smashed 7 years forward GDP levels and all but guarantee a "Japanification" of the US economy or a Neo Fisherian regime of continued stagnation of the US economy. This also means not only that there will be no "V" shape recovery in equity but that US equity have another 20% to 30% to drop in value.
Deriving a 7 year forward GDP via a "Fisher Effect" term structure and using this to qualify US equities.
The Trump administration has experienced a drop in 7 year forward GDP of almost 4 trillion - likely the largest such loss in the history of the US on a % basis or current dollars. While US equities drop has been focused on CV 19 - the long term "Japanification" of the US economy that has been underway since Dec 2018 has yet to be discounted.
Using Modified Merton to Qualify BB OAS spreads 4 13 2020
Lag in Merrill posting their ICE OAS BB index spread to FRED means this is 2 days old - close 4 13 2020.
BB credit spread if accounting for volatility and resulting drop in "distance to default" is very tight now and at risk to widen by 300 to 600 basis points.
"Fisher Effect" Used to Qualify US Equities and to Derive 7 Year Term Structure of GDP
The 7 year forward GDP and the 7 year basis, the difference between GDP in 7 years to current GDP (disaggregated) continues to drop and the term structure of GDP - from 1 year to 7 year - is at its worst since the 2008 crisis. US equity have no support from US GDP forwards.
Using a term structure of Instantaneous GDP out to 7 years based on "Fisher Effect " to value US equities
US equity that has US revenue sourced from US business with little access to international tax avoidance schemes (R2000) is fairly valued to 7 years forward instantaneous GDP but is 20% rich to the 7 year "basis" of instantaneous GDP. SP500 is 22% rich to 7 years forward instantaneous GDP and 40% rich to the 7 year "basis" of instantaneous GDP
Term structure of GDP is historically low and flat.
The 7 year forward GDP growth is now 3/8% and is below that experienced during the worst of 2012. The 7 year forward level is now at 22 trillion, equal to the 7 year forward of Nov 2016. US equity to be in harmony with such extraordinary low levels require a further drop of 20% to 30%.
"Fisher Effect" analysis of of forward GDP levels, US equity then qualified 4/3/20
The forward levels of GDP at the forward "current dollars" is derived by using the "Fisher Effect" understanding of spot Fed Funds and constructing a term structure of Fed Funds for 7 years, The "Fisher Effect" defines this as term structure of GDP. When compared to current equity levels implies equity will fall another 20% to 30%.

BB qualified by Russell 2000 Distance to Default ( Merton) Apr 4 2020
BB spread maintaining recent tightening yet distance to default continues to fall as volatility still rises.
SP500 back to being rich.

BB Credit is likely rich no and will rewiden to new wides
BB credit has tightened but the greatly increased volatility will drive spreads wider.
Using Fisher Effect to build a term structure of NGDP to 7 years and to qualify US equity levels.
7 year forward NGDP level and also the basis, the relationship between 7 year forward NGDP and current GDP have plunged. The term structure of NGDP out to 7 years is approaching the lows of 2012.

Very Grim. Fed has "locked down" forward growth of NGDP to under 1/2%. "Japanification"
The SP500 has about another 20% to 30% to fall and R2000 another drop of 10% to 20%. Fed has, by stubbornly applying Wicksell, locked the US econ into a Japanification or 'Lost Decade"
March 27 close - Fisherian using "Fisher Effect" to devise a NGDP term structure.
The NGDP Fisherian term structure is used to qualify US equity levels. US equity is to make new lows as forward levels of NGDP and the basis in 7 years - the difference between forward NGDP and spot (concurrent NGP)
BB credit - rich/cheap using stochastic process (modified Merton)
BB credit will price to asset volatility for the next while and has now tightened under mistaken idea that Fed buys will tighten credit from supply demand. Perhaps, but only if the Fed returns equity volatility to the low persistent levels of pre-cv19.
Using a "Fisher Effect" Term Structure to Derive Same in NGDP, Then Using This to Qualify Equity
Despite the recent large rally in equities from the Congressional emergency fiscal measures, the forward level of NGDP as derived from using a "Fisher Effect" has continued to drop. If the Fisher Effect does describe NGDP annual growth, then new lows in equity will occur. The emergency fiscal measures are not showing in forward NGDP levels.

BB Credit Spread Stochastic Analysis
BB Credit Spread Stochastic Analysis.
Uses "d2" in Merton Black Scholes to consider if BB credit spread is rich or cheap. Currently BB is likely to still widen. The richness of the SP500 to the R2000 is shown - the R2000 is a more appropriate indication of equity of BB credit.
BB credit fair value, but more widening may come.
For the "norm" from 2012 to date, BB credit is cheap. However there is a possibility the US econ slips into a serious recession and test wides of 2008 and 2009.
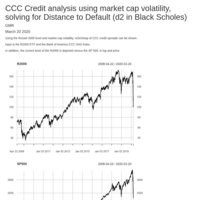
CCC credit at cheap level for the "norm", much further to go if into recession
Considering the worst of 2009 to 2010, CCC credit is now cheap versus trading from 2010 to date, being at the wides experienced up to 2012. But could widen much further if US econ enters into a general recession
CCC credit now cheap
USing a stochastic D2D process.
BB Credit is now cheap - Mar 20 2020
Using a stochastic analysis, BB credit is now very cheap.

Using Fisher Effect to define a term structure of GDP and then qualify equity. Mar 18 2020 close.
The yield curve has steepened significantly. R2000 are cheap versus forward GDP and fairly valued versus GDP growth.

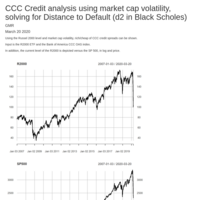
CCC credit analysis using stochastics (volatility)
CCC credit is now cheap, replace all equity exposure with CCC credits.
BB Credit analysis using stochastics/volatility 3/17/20
BB credit is now fairly valued if not cheap.

Using Fisher to qualify US equity - Monday AM 3/16/2020
The Fed is driving the US economy into a state of Japninification, a term which allows the use of Wicksell, but more aptly labelled as a Neo Fisherian sink hole of likely long running stagnant US growth unless the Fed sheds Wicksell and returns to Fisher monetary policy.
Using Fisher Effect derived term structure, R2000 and SP500 is qualified Sunday 3/15/2020
While all eyes are on covid19 - no doubt for good reason - covid19 will pass and as far as populace and infrastructure do little long term damage. However the Federal Reserve response and the resulting Fisher Effect could be a decade long problem as US becomes mired in "Japanification"
CCC using stochastic evaluation.
CCC credit spread is cheap.
BB Credit Spread Qualified by SP500
BB Credit is fairly valued now.
Term Structure Fisher Effect Used to Qualify Russell 2000 and SP500
Given the obvious relationship between US equity and the US economy, a term structure of NGDP is derived using the Fisher Effect spot and out for 7 years. While Russel 2000 was about 15 % overvalued it is now approaching fair value. SP500 is still 10% to 15% overvalued.

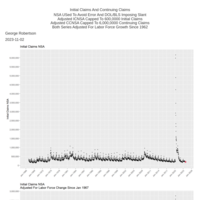
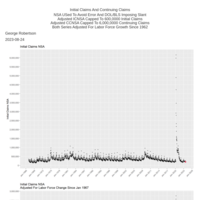
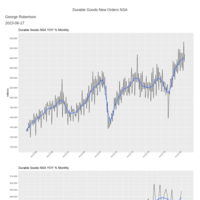
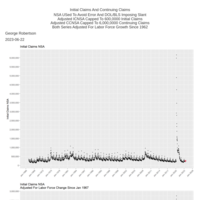
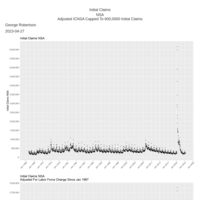
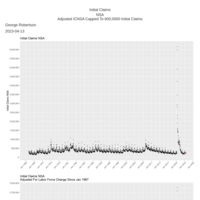
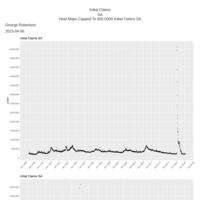
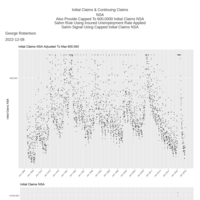
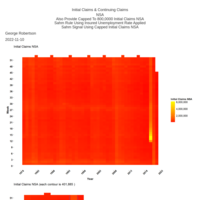
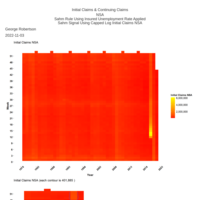
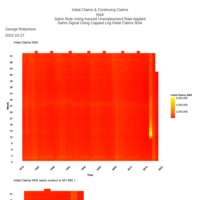
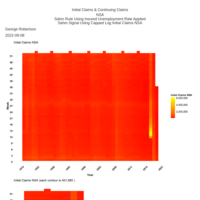
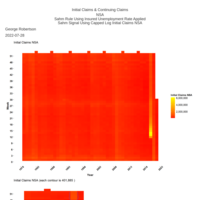
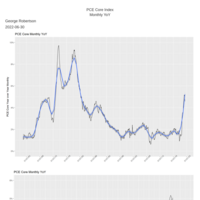
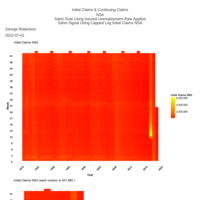
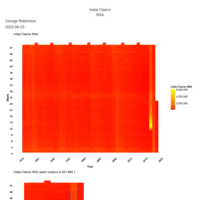
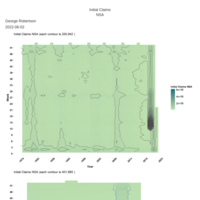
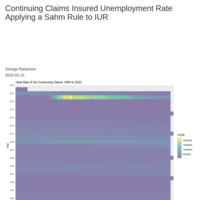
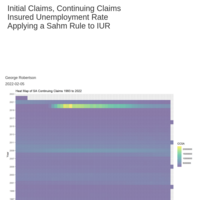
Sahm Rule applied to claims data - approaching recession signal?
Using a very robust approach (ie a ruler over the long run) use Sahm Rule type formulation to find the continuing claims level that signals a recession. That is 8%. We might be closing on to this signal.
Mar 11 2020 BB credit v D2D
BB are now fair value.
US Equity Qualified via "Forward" Fisher Effect Analysis
Current Fed stance and a US Treasury 10 year through 1/2% indicate US equity still has about 20% further to drop. And SP500 is about 15% too high versus solely US domestic/midcap stocks.
Fisher Effect Used to Qualify R2000 and SP500 Levels
Perhaps what is going on is not covid-19, but rather the costs of the Fisher Effect from bizarre low Fed Funds rate is coming due.

Concise Slide Sets - Fisher Effect Used to Qualify US Equity
Extreme misalignment between US risky and risk free assets.
Russell 2000 qualified by a Fisher Effect analysis of forward GDP
If growth is not considered the R2000 is now in synch with US GDP 7 years forward. The 7 years GDP forward is derived by building a term structure of GDP using the Fisher Effect. However the "growth" of US GDP as shown in the Fisher Effect derived term structure indicates R 2000 has much ore to drop.

R2000 at "fair value" versus forward GDP
The SP500 is dominated by only a few stocks - and then mostly Apple. Using the R2000 as a more appropriate measure of US domestic corporations and perhaps a better reflection of GDP, after the sell ff of the last week the R2000 is no longer excessively priced. However it is still rich considering the "basis" of forward GDP.
Using stochastic option math to qualify BB spreads
While BB spreads have opened over the last few days from Covid-19, there is likely more spread widening to come.
Using Volatility to Price BB Credit Spread; Considering How Rich SP500 is to R2000
The current credit spreads are influenced by the record levels in the SP500 and DJIA. However the SP500 does not reflect BB credit quality. Using the Russell 2000 a stochastic volatility based method is used to price BB credit.
Using Fisher Effect to Price Russell 2000
The SP500 level is swamped by a handful of stocks like Apple, Google and Amazon. So the Russell 2000 is used. The Fisher Effect is used to derive the 7 year forward GDP in current dollars. This is then used to price the Russell 2000. This approach shows Russell 2000 10% to 30% rich. The Federal Reserve has induced a Fisher Effect Japanese like "Lost Decade" of sub par growth.
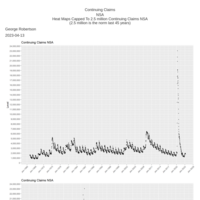
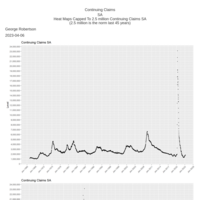
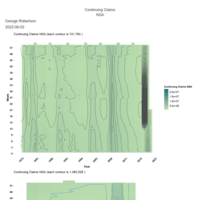
Modified Sahm Rule Using Continuing Claims
Given it is a census and not a survey with little if no revisions and no benchmark change, and given it is weekly - continuing claims (CCSA) should be a better array to use for Sahm Rule.
Stochastic Analysis of AA Credit
Likely, relative to SP500 and SP500 volatility, AA credit has never been richer. A long out of the money calls long dated on the SP500 and long CDX has broken even or returned up to 15% ROC - indication how bizarre pricing.
US Treasurys and Fed Funds Still Completely Out of Synch With Equity Markets
The Fisher Effect can be used to derive a a term structure of US NGDP. Currently such a derived NGDP term structure has never been so out of synch with US equity markets.
CCC using stochastic evaluation seems fairly priced.
Unlike BB and AA credit, which seems unusually rich versus equity level and asset vol, CCC credit seems fairly priced against Russell 2000 level and the Russell 2000 asset volatility.
Stochastic Credit Analysis of BB
Using a stochastic analysis which the main inputs are volatility of the market cap of the Russell 2000 index and the Merrill Lynch OAS BB Index, the current richness of the BB credit spread is shown.
Neo Fisher analysis of US equity and US Treasury term structure and rates.
The level in SP500 and the rate level of US Treasurys and the US Treasury term structure has likely never been so out of synch in the history of the nation. Either the SP500 will drop 30% or more, or Us Treasury "long bonds" will drop 50% or more in price.
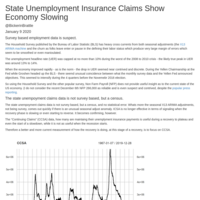
Jan 9th Continuing Claims Indicate a Slowing Economy
The year over year growth of insured unemployment (CCSA) level since Dec 2018 and then surging with the Jan 9th release indicate the US economy is slowing. The beginning of a recession of 8% for a modified Sahm Rule is approached with the modified Sahm Rule now at 4%..
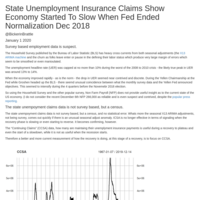
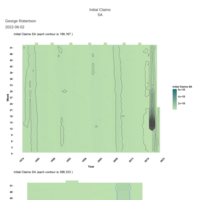
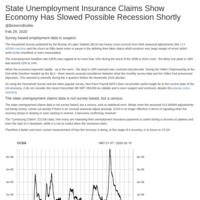
Applying Sahm Rule to State Unemployment Insurance Claims Data
The weekly state unemployment insurance claims are weekly and therefore more timely than the monthly survey data. Furthermore they are an all inclusive census and not surveys so there is no margin of error. Using Sahm Rule and a simple year over year rolling % change of continuing claims levels - a possible economic slowdown started Dec 2018.
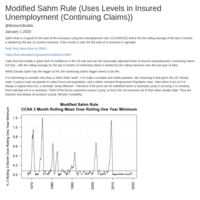
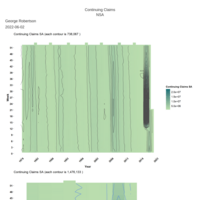
Using a Sahm Rule Process on CCSA
While Sahm Rule process is perhaps one of the more important addition to economic analysis recently, I have problems using the UNRATE (unemployment rate) as I feel the data is corrupt. So I use the weekly unemployment claims data as it is census and impossible to corrupt - in particular I use CCSA (Continuing Claims SA).
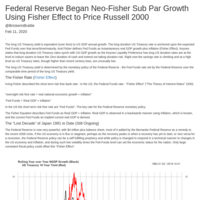
A Federal Reserve Neo Fisherian "Lost Decade" Regime Has US Markets In Peril
A "lost decade" regime - a Neo Fisherian regime - has induced sub par US NGDP growth, now under 2% per year. Either the Fed resumes normalization and long maturity US Treasurys drop 30% in price, or the SP500 discount a long lasting sub 2% NGDP growth phase and drop 30% or more. Or perhaps a combination of both.

The Federal Reserve Still Striving to Crush US Equity Market
he sudden reversal of Federal Funds rate "normalization" in December 2018 and then subsequent drop in rates to the current 1 3/4%, is near certain to induce a period of stagnant growth in US GDP unless Trump counters this policy with large fiscal adds.
Stochastic Analysis of AA Credit
Using "distance to default" or "D2D" - AA credit at record rich. Spreads ready to blow up and double. Risk can be confortably managed using OTM SP500 calls and still makes 20% to 40% ROC. When credit blows will make 80% to 150% on risk capital.
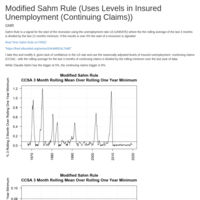
Modified Sahm Rule Using Insured Unemployment (CCSA)
A signal for beginning of a recession based on when moving 3 month average of insured unemployment exceeds the previous rolling annual minimum is 8% or higher.
Atlanta Fed GDPnow indicates 4th Q GDP will be under 1.4% - consistent with a Neo Fisher regime.
Extraordinary low Fed Funds rate and ending normalization of Fed Funds a year ago, has likely put US GDP into a Neo Fisherian regime, a "lost decade". This regime will be incompatible current SP500 levels and they will drop 20% to 30%. (There is the possibility that large federal public sector investment by Trump along with US Treasury issuing ultra long term debt could wrench the US out of this regime and offset the Federal Reserve.)
Publish Document
The Fed induced Neo Fisherianism regime continues. SP500 levels seem oblivious to a long term drop in GDP growth of around 1%..
US Economy Solidly Midst of a Neo Fisherianism "Lost Decade"
The term structure of annual GDP growth now at 1% or lower 2 years to 7 years. The risk premium on a smoothed and thereby somewhat lagged basis now at 10 basis points per year or lower.
Over 3 trillion of 7 years forward GDP growth has been lost from Trump peak levels of 7 years forward GDP reached as soon as only a year ago.
Federal Reserve Neo Wicksell policy is destroying odds that Trump is re-elected.
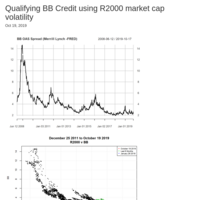
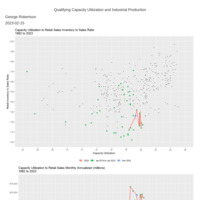
Qualifying BB Credit using R2000 market cap volatility
Most evaluate credit spread using either unqualified empirical record of the spread, or a ex post Graham Doddd/Altman like analysis. This provides little insight into credit spreads. A more useful approach is to qualify credit spreads by the asset volatility.

With Extraordinary Low Fed Funds Rates, Fed Reserve Caps Equity
The Ne Fisherianism regime, recently brought about by Fed ending normalization in December 2018 and then cutting Fed Funds twice, continues which supports a much lower SP500 of 2000 to 2200.

Fed Has Induced a Neo Fisherian "Lost Decade"
If Fed does not resume normalization of Fed Funds towards a Taylor Rule like Fed Funds rate, US GDP will enter a long period of stagnant GDP growth of 0% to 1 1/2% annual NGDP change. This cannot support current SP500 levels and likely draws the SP 500 down towards 2000 to 2200 level, a drop of 15% to 25% in SP 500 current levels.
Forward Level of NGDP Has SP500 Trading Down to 2500
Using Irving Fisher's theory on interest rates, a term structure of GDP (current dollars) growth and level can be derived out to 7 years. A sharp plunge in 7 years forward GDP level indicates SP500 should trade down sharply.
Using Neo Fisherianism to Qualify SP500
If SP500 seeks to discount expected future US economy, a Neo Fisherianism derived forward GDP (current out to 7 years) does not support current SP500 levels and suggests SP500 will drop to levels below 2500.
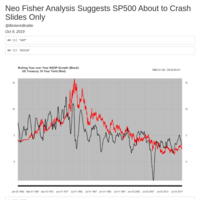
Update - Neo Fisher Analysis Suggests SP500 to Crash
Current rate level, US Treasury volatility, US Treasury curve, and forwards do not support current SP500 levels. Support is about 2500 and then 2200 thereafter
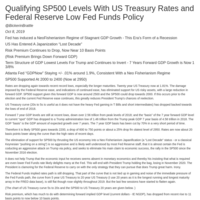
Tremendous Pressure on NGDP Continues By Massive Fed Reserve Policy Error
If around - say plus minus 75 basis points - the "Taylor Rule" rate, the Fed can effectively tighten or loosen with efficacy. But when far from the "Taylor Rule" rate the opposite occurs where the "Fisher Equation" rate imposes with a large policy error and defines NGDP. Now the "Fisher Equation" is so low that a Neo Fisher regime is started with NGDP below 2%. This eliminates support for SP500 and likely drops towards 2200.
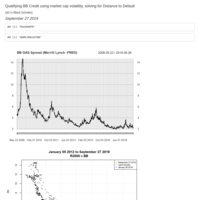
BB Credit Spread Poised to Jump Higher - 4% to 5% Likely
Credit in the end, especially for an index, always trades to volatility, a stochastic process.
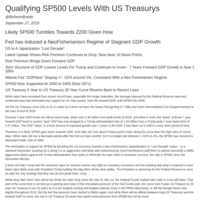
Fed Policy Striving for a Consistent Sub 2% Neo Fisher Regime
Fed Reserve by first refusing to normalize and then even dropping Fed Funds 50 basis points since July 31 2019, has likely induced a Neo Fisher regime of stagnant GDP growth around 1 1/2%. This "Japanization" ("lost decade") of US macro cannot support an SP500 much above 2500.

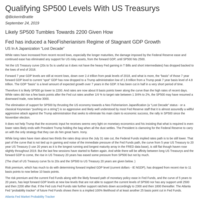
Neo Fisherianism Analysis Indicating SP500 Has No Support Until 2500
While noisy, SP500 (the "stock market") obviously reflects the expectations of the US NGDP - both inflation and real GDP. Recent Fed policy to not only cease normalization towards a Taylor Rule level or even reduce Fed Funds despite a robust economy is signaling a Japan like Neo Fisher "lost decade" stagnant US GDP growth.
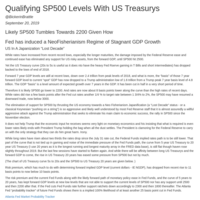
Using Neo Fisherianism to derive a term structure of NGDP and then qualify SP500
SP500 has duration and current GDP has by definition "0" duration or even a negative duration being ex post. SP500 is likely to drop towards 2000.

Stochastic analysis of BB Credit Spreads
BB credit ready to double in spread.

Federal Reserve Has Induced A Fisherianism "Lost Decade": SP500 to 2200
The ease in Fed Funds despite record low unemployment and solid US economy has dropped GDP 7 year forward level by $2.4 trillion. More alarming is that the "basis", the difference between 7 year GDP and current GDP has down $3 trillion in less than a year. SP500 likely to 2200 or lower.
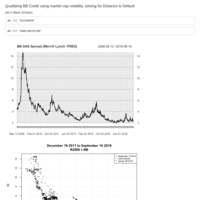
Stochastic Analysis of BB Credit
Using the asset volatility of BB credit, estimated by taking the average capital structure of Russel 2000 equity and the its asset volatility. This provides a a "distance to default". This is used to qualify BB credit spread.
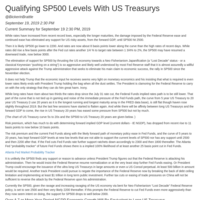
US Treasury curve, volatility and forwards used to qualify SP500 levels.
US current US Treasury rates, curve, forwards, and vol a risk premium is derived which then is used to build a forward Fisher Equation term structure or a NGDP forward term structure. The implied 7 years forward GDP (NGDP) is derived which then provides a duration match to current SP500.
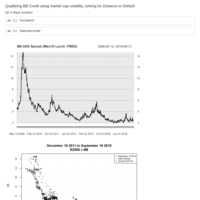
Stochastic BB Credit Spread Analysis
Assuming volatility is the best ongoing risk measurement, and that credit spreads are a pricing of risk, a straightforward stochastic measure of how far from strike ("d2" in classic BSM) the underlying - in this case using the Russel 2000 stock index - is with the strike being bankruptcy. Then this distance to default is used to qualify current BB credit spread.

Using US Treasury rates, curve, and volatility to qualify SP500 levels
The risk premium for US Treasurys is derived and then a "Fisher Rate" term structure is built. This is considered to be equivalent over time to a Fed Funds term structure. The Fisher Rate is equivalent to NGDP as Fisher Equation and a GDP level for 7 years is calculated. This is used to qualify SP500 levels.

BB Credit stochastic spread analysis
BB credit spread seems unusually tight and likely to surge wider.
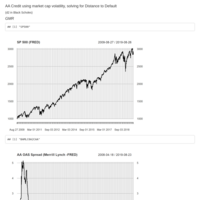
AA Credit Is Very Rich, Spreads to Widen
Using stochastics to consider AA credit.
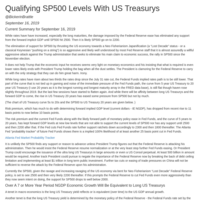
Fisherianism Qualifying SP500, and Critique of Federal Reserve
Most use a direct comparison of current GDP to SP500 levels. This is wrong with a large duration mismatch. The right way is to use a forward GDP level to qualify SP500. With that it shows the Federal Reserve is in midst of a sincere policy error and SP500 set to fall to first 2500 then 2200. This has obvious serious political repercussions

Using Fisher Equation to Qualify SP500 Levels
Using the Fisher Equation to build a forward term structure of Fisher Equation which is then considered to be a term structure of NGDP. The model takes this forward Fisher Equation rate to 7 years (28 quarters).
This model indicates the Fed, in the main, has moved the US into a Japanese like "Lost Decade" of entrenched sub par growth that will be sticky and difficult to shake off.
The main cause of this was to shed the monetarism of the previous 40 years and replace it with a strange brew of "Neo Wicksell" and "Odyssean" monetary policy which allowed the Fed Reserve for various political reasons to not normalize rates from post "Great Recession" to date.
If the US does not wish to endure another 10 years of sub par growth, they will lose about 2% per year of NGDP or about 15% over the next 7 years.
If this occurs the US NGDP levels will not support the current SP500 valuations. A correction of several hundreds of SP500 points is likely in store with minor support at 2600 and former support at 2200.
It seems President Trump does not understand this problem and is in fact clamoring for the main problem - Fed Funds rates well below "normal", certainly well below the potential GDP of the Fed, NBER and CBO.