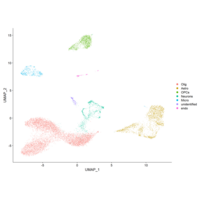
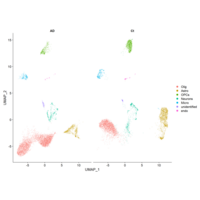
CLJ
lianjin
Recently Published
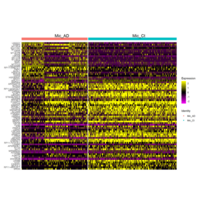

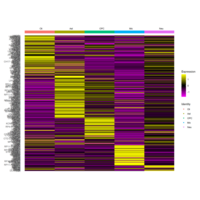
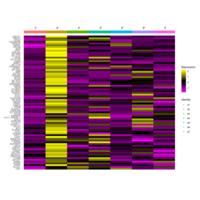
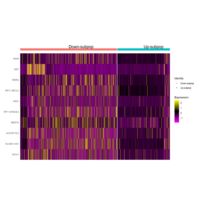
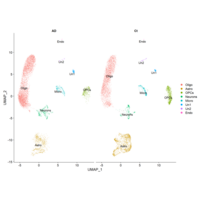
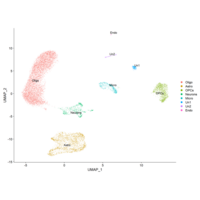
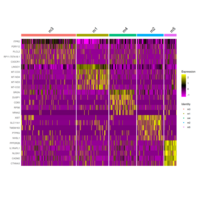
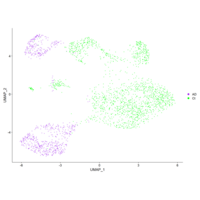
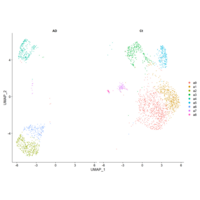
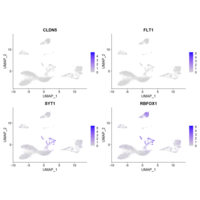
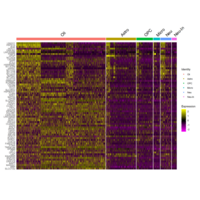
All.DEG
log.FC>0.5 or < -0.5
up enriched in Oli, (samples size fuel this result)
down enriched in Ast, OPCs
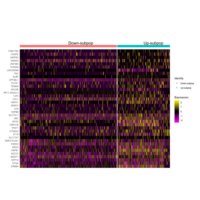
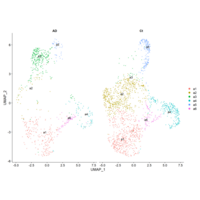
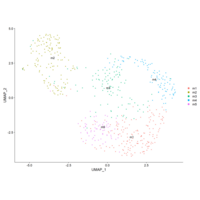
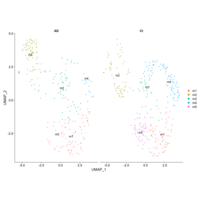
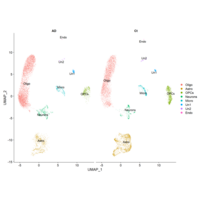
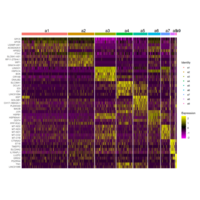
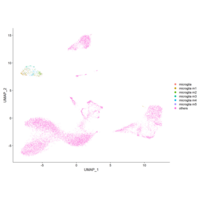
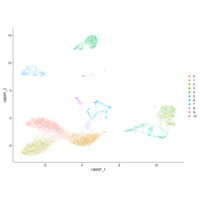
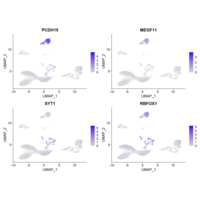
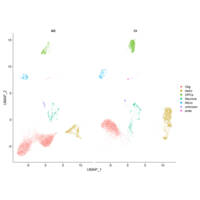
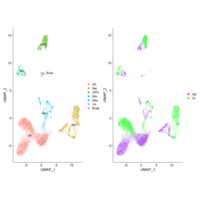
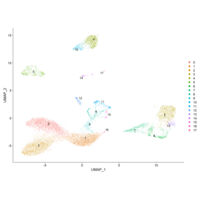
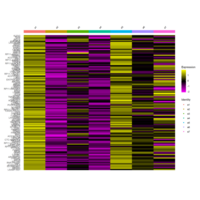
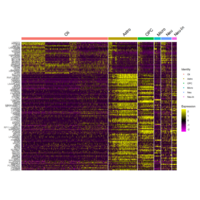
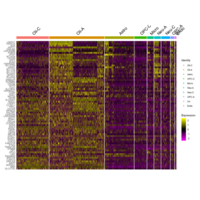
A-DEG
Up enriched in a2 (a4 is also the AD-astrocyte subpop)
Down enriched in a1 and a5
whats a1 and a5 markers? -> AD lack such expression
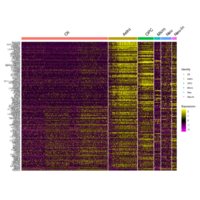
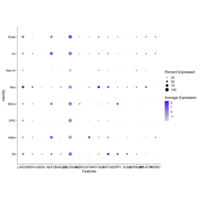
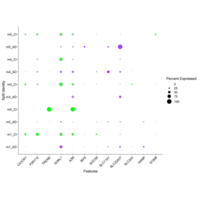
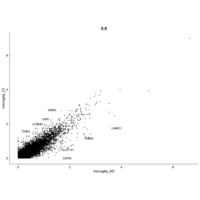
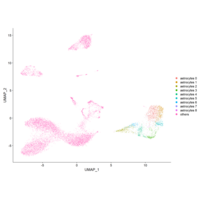
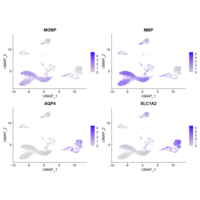
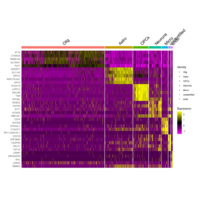
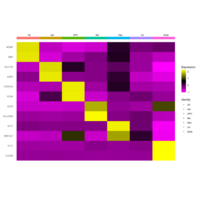
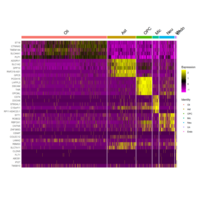
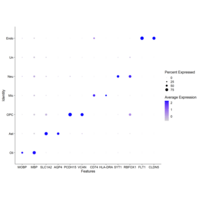
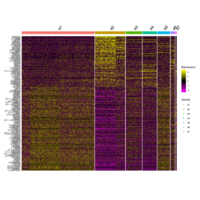
A.markers(down)
log2FC>0.4