
Blago_1
Lewis Blagogie
Recently Published
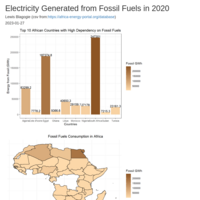
Electricity Generated from Fossil Fuels in Africa (2020)
This report visualizes csv data acquired from Africa Energy Portal on Fossil Fuels in Africa's Energy mix.
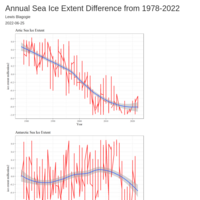
Annual Sea Ice Extent Difference from 1978-2022
Data from https://climate.metoffice.cloud/sea_ice.html is wrangled and visualized showing global annual sea ice extent.
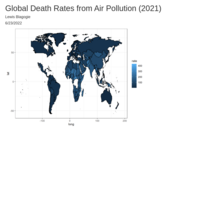
Global Death Rates from Air Pollution (2021)
I map data collected from https://ourworldindata.org/ showing the global death rates resulting from air pollution
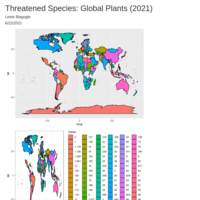
Threatened Species: Global Plants (2021)
csv from the World Conservation Union is wrangled and transformed to produce this spatial variation in threatened plants globally in 2021.
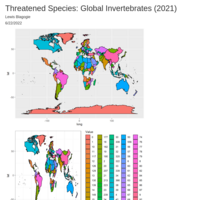
Threatened Species: Global Invertebrates (2021)
csv from the World Conservation Union is wrangled and transformed to produce this spatial variation in threatened invertebrates around the globe in 2021.
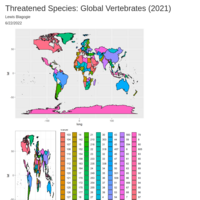
Threatened Species: Global Vertebrates (2021)
csv from the World Conservation Union is wrangled and transformed to produce this spatial variation in threatened vertebrates around the world in 2021.
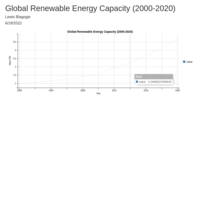
Global Renewable Energy Capacity (2000-2020)
A time series showing the global trend in Renewable Energy Capacity over the years
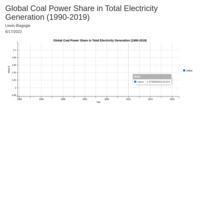
Global Coal Power Share in Total Electricity Generation (1990-2019)
Data from https://climateactiontracker.org/ is retrieved and plotted to show global coal share in total electricity generation over the years
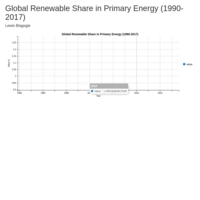
Global Renewable Share in Primary Energy (1990-2017)
Data from https://climateactiontracker.org/ visualized showing the percentage of renewable sources in the global energy mix from 1990 to 2017
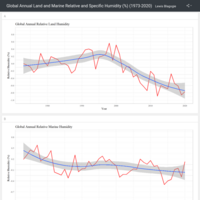
Global Annual Relative and Specific Humidity for Land and Marine Over The Past Five Decades
visualizations of annual global relative and specific humidity. csv data from: https://climate.metoffice.cloud/dashboard.html
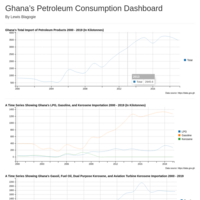
Ghana's energy import and consumption from 2000 to 2019
Here, I visualize data on Ghana's energy trends over the past decade.